+91 9312966129
 sparc.enquiry01@gmail.com



Microsoft Fabric for Beginners: A Practical Introduction
Microsoft Fabric for beginners made simple: key terms, OneLake basics, which tool to try first and a 4-week plan with a small project. Start learning.

Table of Contents
- What Fabric Means, in One Picture
- Why It Is Worth Your Time
- Vocabulary Cheat Sheet
- OneLake Basics
- Which Tool Should You Touch First?
- A Four-Week Plan for Microsoft Fabric for Beginners
- Week 1: Strengthen the Base
- Week 2: Meet the Platform
- Week 3: Load and Clean Data
- Week 4: Report and Reflect
- Mini Project: A Stationery Shop Tracker
- What You Can Realistically Expect
- Common Pitfalls and Quick Fixes
- Where This Leads
- Conclusion
Picture a shop owner with sales in one spreadsheet, stock in another and supplier bills in a third. Every month, someone spends two days copying numbers between files before a single chart can be drawn. Microsoft Fabric exists to shrink that kind of effort, and this guide to Microsoft Fabric for beginners shows how, without assuming prior experience.
If terms like "dataset" or "dashboard" still feel vague, skim What is Data Analytics? A Beginner Guide and then come back.
What Fabric Means, in One Picture
Imagine a school campus. Different buildings teach different subjects, yet all of them borrow from one central library. Fabric works the same way: separate tools for moving data, querying it and drawing charts, all sharing one library of data.
In short, it is one online platform where data is brought in, stored, cleaned, analysed and reported on. Microsoft built it by combining ideas from Power BI, Azure Synapse and Azure Data Factory. If you are weighing the platform against Power BI itself, our guide to Microsoft Fabric vs Power BI explains which to choose.
Why It Is Worth Your Time
Most analysts lose hours to plumbing: finding files, fixing formats, repeating exports. Cutting that waste is the main promise of Fabric data analytics. Three practical reasons stand out:
- Less copying. One shared storage layer means fewer duplicate files.
- Clearer ownership. Work lives in workspaces with defined access.
- Smoother reporting. Power BI reads from the same place where your cleaned data sits.
Learning Microsoft Fabric for beginners also builds habits that transfer to any tool, because you understand where data lives and how it flows. To see how the field is changing, read about the future of business intelligence careers.
Vocabulary Cheat Sheet
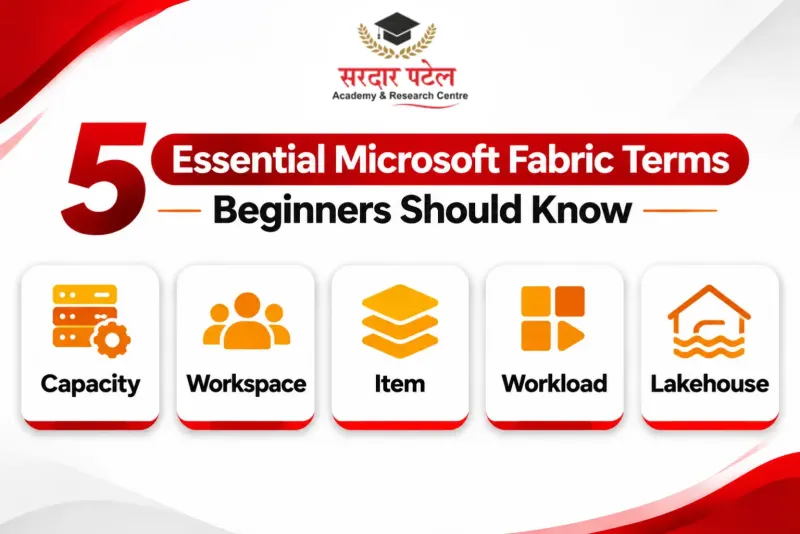
| Term |
Meaning |
Everyday comparison |
| Capacity |
The compute power that runs your tasks |
Electricity supply to the campus |
| Workspace |
A shared area for related work |
One classroom for one project |
| Item |
Anything you create: report, notebook, lakehouse |
A notebook or file in that classroom |
| Workload |
A specialised experience such as Power BI |
A subject department |
| Lakehouse |
Storage that keeps raw files and tables side by side, ready to query |
A library with a catalogue |
OneLake Basics
OneLake is the central library in our campus picture. Every Fabric experience stores its data there, so you do not keep separate copies for each tool. Tables are saved in the Delta Lake format, which uses Parquet files underneath, so different tools can read the same data without conversion.
Governance matters even for a learner. Microsoft Learn's OneLake security documentation explains that access can be controlled at more than one level. In plain terms: who may enter the classroom, who may open a particular notebook, and what each tool may read.
That is enough OneLake knowledge to start with. A later bonus is Direct Lake, a mode that lets Power BI read OneLake tables quickly; leave it for after your first project.
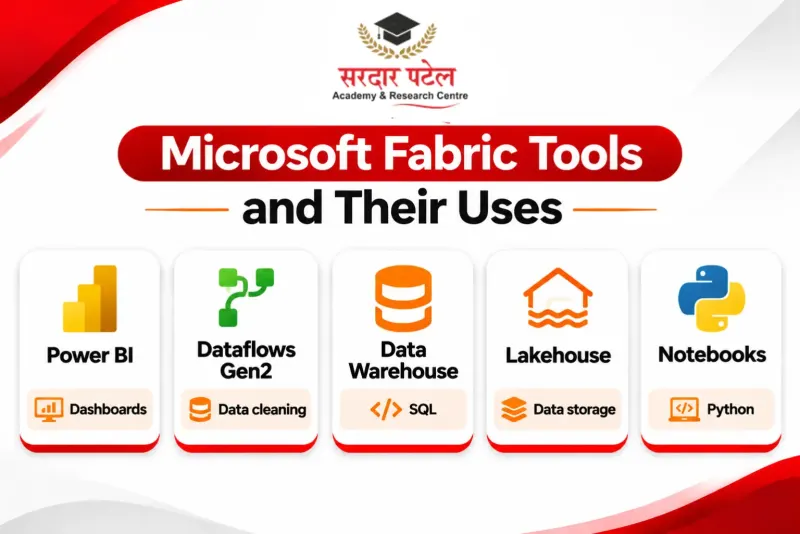
Which Tool Should You Touch First?
Your goal decides where to begin.
| If you want to... |
Start with |
| Make charts and dashboards |
Power BI |
| Load and tidy files without code |
Dataflows Gen2 |
| Run SQL on structured data |
Data Warehouse |
| Store raw files plus tables |
Lakehouse |
| Try Python on your data |
Notebooks |
| Predict outcomes or watch live streams |
Data Science, Real-Time Intelligence (later) |
For most people, a lakehouse plus Power BI is the gentlest path. A common question is whether to learn SQL or Python first. SQL is usually the better opener, because it teaches you to think in tables and filters. Python follows once you want automation, and learning to automate Excel reports using Python is a friendly bridge into Fabric notebooks.
Newer helpers such as Copilot exist inside Fabric, but features and availability change, so check Microsoft's documentation before relying on them. Our post on Power BI Copilot in 2026 covers that side in more depth.
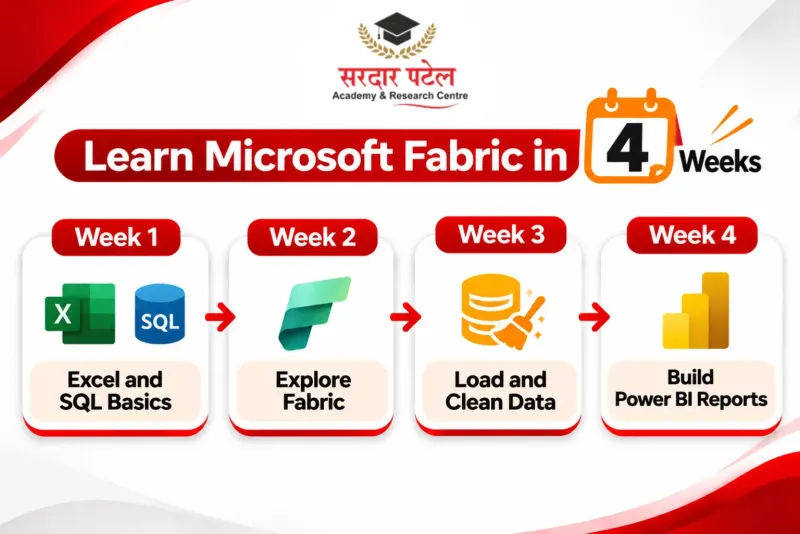
A Four-Week Plan for Microsoft Fabric for Beginners
This plan is our own suggested pacing, not an official Microsoft schedule. It assumes you know a little Excel and can give it a few hours each week.
Week 1: Strengthen the Base
Revise Excel formulas, learn basic SQL joins and understand what a table, a key and a chart are. A structured Advanced Excel course covering lookups, pivot tables and dashboards is a good warm-up.
Week 2: Meet the Platform
Start with your licence. Microsoft's trial needs a Power BI licence or a free Fabric licence first, and trial terms change, so confirm the current details on Microsoft's trial page. Then set up your workspace the way Microsoft's lakehouse tutorial does:
- Sign in to the Fabric portal at app.fabric.microsoft.com.
- Select Workspaces, then + New workspace, and give it a name.
- Expand Advanced and, under Workspace type, choose Fabric Trial capacity.
- Select Apply to create and open the workspace.
Do not skip step 3. Without a trial or paid capacity attached, the workspace cannot hold lakehouse items. Spend the rest of the week clicking around and noting which workloads you recognise from the vocabulary table above.
Week 3: Load and Clean Data
Now you start working with real data. Create a lakehouse, upload a CSV and tidy it with a dataflow, or try a notebook if you like code. Microsoft's lakehouse tutorial offers a guided example, and Microsoft Learn also hosts free training modules such as "Get started with lakehouses in Microsoft Fabric".
Week 4: Report and Reflect
Connect Power BI to your cleaned tables and build four visuals that answer real questions. Finish by writing a short note on what you built; it becomes portfolio material for your first data analytics job search.
Mini Project: A Stationery Shop Tracker
A small project beats a big plan. Use a CSV with these columns: Date, Item, Category, Quantity, Unit Price, Amount. Then:
- Collect three months of sales in that format.
- Upload the file to a lakehouse in a new workspace.
- Fix date formats and remove duplicate rows.
- Report top-selling items, sales by week and slow-moving stock.
- Write three observations a shopkeeper could act on
If the reporting step feels unfamiliar, a Power BI dashboard tutorial gives layout ideas. This one exercise touches storage, cleaning and reporting, which is exactly what Fabric data analytics is about.
What You Can Realistically Expect
After a month of steady effort, a learner should be able to explain what Fabric is, load a small dataset into a lakehouse, clean it and publish a basic report. That is a solid foundation, and an honest limit: enterprise design, capacity planning and advanced governance take real project experience. Treat this Microsoft Fabric for beginners guide as the first rung, not the whole ladder.
Because the Microsoft data platform keeps evolving, set small targets, such as finishing one tutorial a week. Analytics in Fabric rewards repetition more than speed. To see how reports, dashboards and analysis fit together, the beginner guide to business intelligence is a helpful companion.
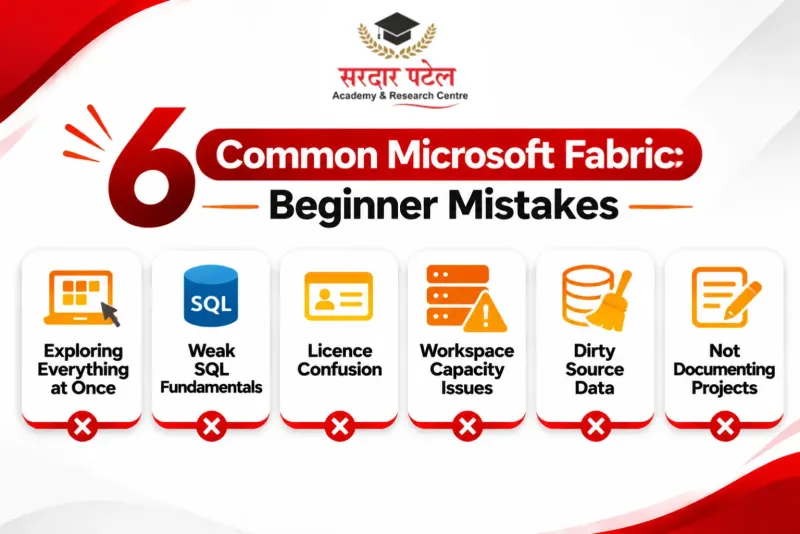
Common Pitfalls and Quick Fixes
Most stumbles come from moving too fast.
| Pitfall |
Quick fix |
| Opening every workload on day one |
Stick to lakehouse and Power BI for a month |
| Weak SQL or modelling basics |
Spend week one on fundamentals |
| Confusion about licences and trials |
Check the trial status in your account manager; read the current terms before starting |
| Workspace has no lakehouse option |
Confirm the workspace uses trial or paid capacity |
| Dirty source data |
Clean before you chart |
| No record of your work |
Save screenshots and notes for every project |
If you get lost in the interface, Microsoft's lakehouse tutorial walks through each screen step by step.
Where This Leads
Once Microsoft Fabric for beginners feels comfortable, you can explore data engineering, warehousing or advanced Power BI modelling. Delhi learners who prefer classroom guidance can train at Sardar Patel Academy & Research Centre in GTB Nagar, which offers free demo classes so you can see the teaching style first.
Conclusion
Microsoft Fabric for beginners does not require a giant leap. Learn the vocabulary, remember that OneLake is the shared library, pick the lakehouse and Power BI as your starting pair, and finish one small project. The rest of the Microsoft data platform becomes easier to explore after that.
Want a structured foundation before you dive in? Start Learning Data Analytics
FAQs
Begin with Excel, SQL and Power BI basics, then create a workspace, a lakehouse and one small report.
Yes. Many learners start from Excel and build up through SQL and Power BI. Hiring requirements vary by employer, so projects and practical skills matter.
It lets you bring in data, store it, clean it, analyse it and report on it inside a single online platform.
No. Dataflows and Power BI are low-code. SQL and Python become useful as your projects grow.
Not to begin. Microsoft offers a 60-day Fabric trial capacity, which you start from the account manager in the Fabric portal. You first need a Fabric (Free) or Power BI licence. If you sign in with a college or office account and the Start trial option is missing, your admin may have switched trials off; they need to keep the tenant setting "Users can try Microsoft Fabric paid features" enabled. When the trial ends, non-Power BI Fabric items stop working unless the workspace moves to a paid capacity, so export or note down your project work. Terms change, so check Microsoft's current trial page.
No. Power BI is one of the Fabric workloads and still works on its own. Our Microsoft Fabric vs Power BI guide covers the difference in detail.
A lakehouse accepts raw files and tables, while a warehouse is a structured store designed for SQL queries.
Your learning speed will vary based on your current knowledge and the amount of time you dedicate to practising. Learners comfortable with Excel and SQL often find the introductory tutorials manageable within a few weeks.