+91 9312966129
 sparc.enquiry01@gmail.com



What Is Augmented Analytics and How Does It Work?
Learn what augmented analytics is, how it works, how it differs from traditional BI, and which tools offer it. A simple guide to AI-driven data insights.
Every business today sits on a mountain of data, yet most teams still struggle to turn it into decisions. Dashboards pile up, reports arrive late, and the few analysts who can dig deep are overloaded with requests. This gap between having data and using it is exactly where augmented analytics steps in.
This guide explains what it is, how it works step by step, how it differs from traditional BI, and which tools offer it today.
What Is Augmented Analytics?
Augmented analytics is an approach to data analysis that uses artificial intelligence (AI), machine learning (ML), and natural language processing (NLP) to automate tasks that analysts once did by hand. These tasks include preparing data, finding patterns, building models, and explaining results in plain language. The term was introduced by Gartner in 2017, and its official glossary definition describes it as using ML and AI to assist with data preparation, insight generation, and insight explanation.
The word "augmented" is important. The goal is not to replace people. It is to extend what people can do. A marketing manager with no coding skills can ask a question in simple words and receive a clear answer.
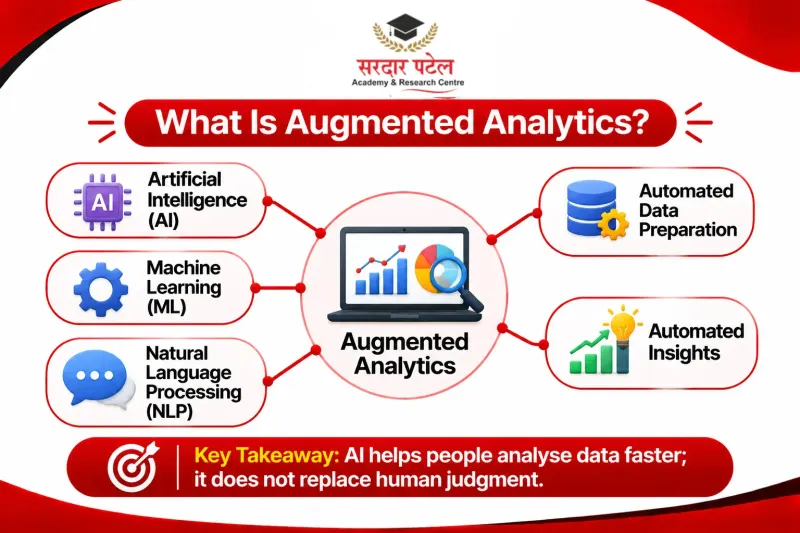
In short, it makes data analysis faster, easier, and open to everyone, not only technical experts.
Why Traditional Business Intelligence Falls Short
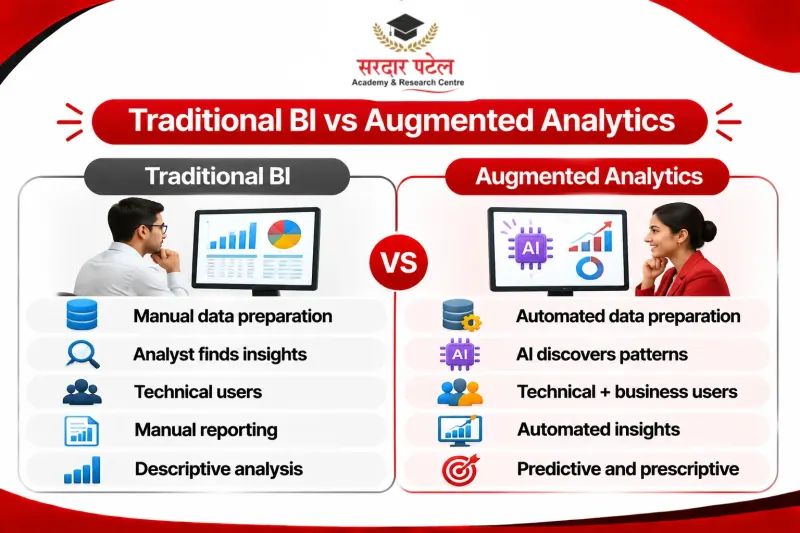
Traditional business intelligence (BI) relies heavily on human effort: an analyst decides which questions to ask, builds the charts, and checks the numbers. That makes it slow, limited by human attention, dependent on a small group of specialists, and open to bias, because analysts tend to look where they already expect to find answers. Augmented analytics lets software do the heavy lifting. If you want the fundamentals of BI first, read our Beginner Guide to Business Intelligence.
How Does Augmented Analytics Work?
Behind a simple question and a clear answer, several technologies work together.
1. Data Collection and Preparation
The platform pulls data from databases, spreadsheets, cloud apps, and CRM or ERP systems. Machine learning then flags duplicates, missing values, and inconsistent formats, and suggests fixes automatically.
2. Pattern Discovery Using Machine Learning
Once the data is ready, ML algorithms scan it for relationships, trends, clusters, and unusual behavior. Instead of waiting for a person to test one idea at a time, the system tests thousands of combinations in minutes.
For example, it might notice that sales in one region drop every time a certain delivery partner is used, or that a specific group of customers is likely to cancel their subscription soon.
3. Automated Insights
This is the heart of the technology. Automated insights are findings that the system surfaces on its own, without being asked. The platform highlights what changed, why it changed, and what deserves attention.
Rather than showing you a chart and leaving the interpretation to you, the tool may say that revenue fell 8 percent last month and that most of the drop came from one product category.
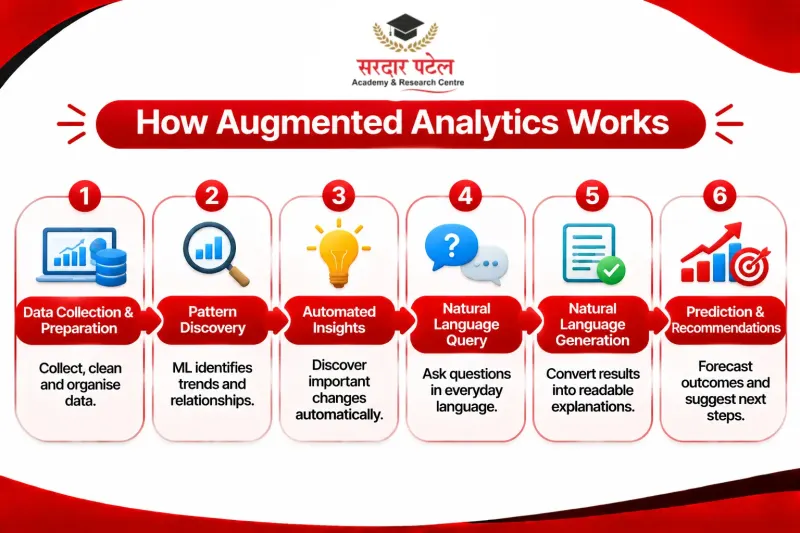
4. Natural Language Query and Search
NLP lets users ask questions the way they talk, such as "Which products earned the highest profit last quarter?", and the system turns the question into a database query behind the scenes. Tools like Power BI Copilot in 2026 bring this directly into dashboards.
5. Natural Language Generation
After analysis, the tool explains results in written summaries rather than leaving users to decode complex charts. Natural language generation (NLG) turns numbers into short, readable stories that anyone in the business can understand and share.
6. Prediction and Recommendations
Advanced platforms add forecasts and suggested actions, moving teams from "what happened?" to "what will happen, and what should we do?" The modelling side is covered in our guide to AI predictive analytics.
Key Technologies Behind Augmented Analytics
Three core technologies power most platforms:
- Machine learning: finds patterns, builds models, and improves with more data.
- Natural language processing: understands questions written or spoken in everyday language.
- Automation engines: run data prep, report refresh, and alerts without manual effort.
Together, these form the foundation of modern AI business intelligence, where the software actively helps users think, not just display charts.
Augmented Analytics vs. Traditional BI
| Feature |
Traditional BI |
Augmented Analytics |
| Data preparation |
Manual |
Automated with ML |
| Finding insights |
Analyst-driven |
System-driven |
| Who can use it |
Mostly technical users |
Business users too |
| Speed |
Often days or weeks |
Often minutes |
| Questions |
Written as queries |
Asked in plain language |
| Outcome |
Descriptive reports |
Predictive and prescriptive guidance |
Augmented Analytics Tools You Can Try Today
Several major platforms already offer augmented analytics features. The points below come from each vendor's own documentation. Availability and licensing change often, so confirm current details before you buy.
Power BI Copilot. A chat-based assistant that can summarize report pages, answer questions about your data, and help write DAX. According to Microsoft Learn, an administrator must enable Copilot in Fabric and you need paid capacity (F2 or higher at the time of writing), so a basic Power BI licence alone is not enough. Some experiences are still labelled preview.
Tableau Pulse. Built into Tableau Cloud, it gives people personalized insights about the metrics they follow, so they do not need to build an analysis themselves. A site administrator has to switch it on, as described on Tableau's help pages.
Qlik Insight Advisor. Part of Qlik Sense, it generates charts from natural-language questions and uses associative insights to reveal relationships you may have missed. Qlik explains how it works in its Insight Advisor documentation.
ThoughtSpot Spotter. Described by the vendor as an AI analyst, it lets users ask business questions in plain language and get charts with written summaries. Search tokens let users check how an answer was built; see the Spotter documentation.
Real-World Use Cases
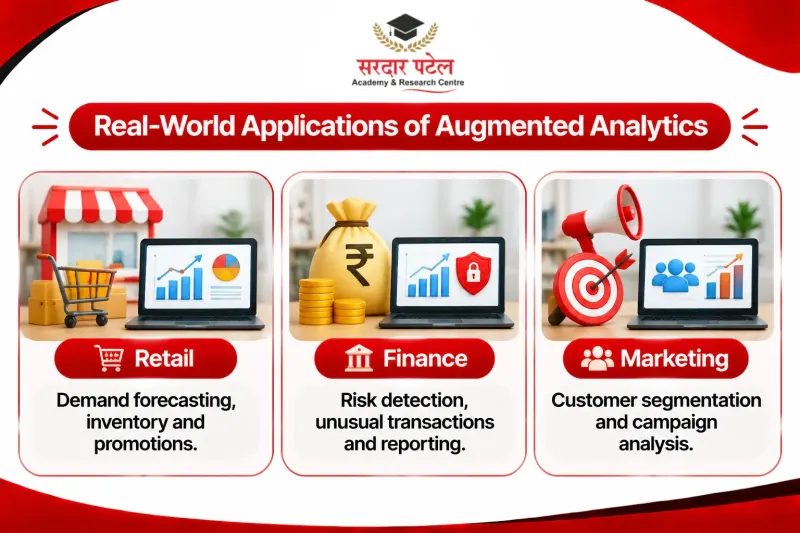
- Retail: forecasting demand, tracking inventory, and finding which promotions actually work.
- Finance: detecting unusual transactions, assessing credit risk, and speeding up monthly reporting.
- Marketing: identifying high-value customer segments and measuring campaign performance in near real time.
An Indian Example
Indian technology services firms are part of this market. In June 2020, Pune-based Zensar told the stock exchange that it would offer ThoughtSpot's search and AI-driven analytics as a service to enterprise customers, as stated in its BSE filing. That filing describes a service offering, not measured customer results, so read it as a sign of adoption rather than proof of impact.
Benefits of Augmented Analytics
- Faster decisions. Tasks that took days can take minutes, so leaders can act while information is still fresh.
- Wider access to data. Non-technical employees can explore data themselves, which reduces the burden on analysts and builds a data-driven culture.
- Fewer missed insights. Machines can examine far more combinations than a human team, surfacing hidden trends and early warning signs.
- Reduced bias. Because the system explores data broadly, it is less likely to be shaped by an analyst's assumptions, though it can still reflect bias in the underlying data.
- Better use of expert time. Analysts spend less time on routine cleaning and reporting and more on strategy and complex modeling.
New to the field? Our guide What is Data Analytics? Beginner Guide covers the basics that make these tools easier to use well.
Challenges to Keep in Mind
This technology is powerful, but it is not magic.
- Data quality still matters. Automation can clean data, but poor or incomplete sources lead to weak insights.
- Trust and transparency. Users should understand how a conclusion was reached, so choose tools that explain their results.
- Skills and change management. Teams need training to ask good questions and to question the answers they receive.
- Privacy and governance. Sensitive data must be protected with proper access controls and compliance practices.
Human judgment remains essential. The best results come when people review, challenge, and apply what the system suggests.
How to Get Started
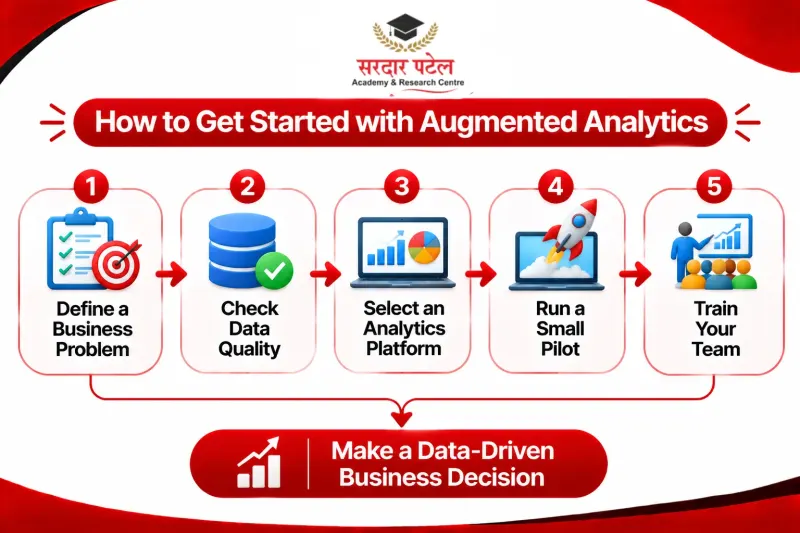
- Define a clear business problem. Start with one goal, such as reducing customer churn or improving sales forecasts.
- Check your data foundation. Identify where your data lives and fix major quality issues first.
- Choose the right platform. Look for strong natural language search, automated insights, easy integrations, and clear explanations.
- Start small. Run a pilot with one team and measure the impact. A good first project in the Microsoft ecosystem is an executive KPI dashboard in Power BI.
- Train your people. Help employees build data literacy so they can use insights with confidence.
The Future of Augmented Analytics
Conversational assistants, real-time alerts, and AI agents are becoming standard features. Over time, analytics will feel less like opening a dashboard and more like talking with a knowledgeable colleague. For the wider picture, see the Latest Data Analytics Trends in 2026.
Conclusion
Augmented analytics combines AI, machine learning, and natural language processing to automate data preparation, uncover hidden patterns, and explain results in simple language. By bringing together automated insights, analytics automation, and AI business intelligence, it helps every team, not just data experts, make faster and smarter decisions.
Want to work with these tools yourself? SPARC's Data Analytics Course with AI is an 8-month program with 40+ projects covering Excel, SQL, Python, Power BI, Tableau, and modern AI tools, with placement support. Book a free demo class and see how you can build job-ready analytics skills.
FAQs
It is data analysis that uses AI to prepare data, find patterns, and explain results in plain language, so people without technical skills can understand their data.
In traditional BI, analysts decide what to look at and build every report by hand. In augmented analytics, the software finds patterns on its own, answers questions asked in everyday language, and explains what it found.
No. It handles routine work such as cleaning data and building first-pass reports, while analysts focus on judgment, strategy, and checking whether the answers make sense for the business.
Not to ask questions or read insights, since most tools accept plain-language questions. Building reliable data models and checking results is easier with skills in Excel, SQL, and BI tools.
No. Some tools are priced and designed for smaller teams, but the best starting point is one clear problem and clean data, whatever the company size.