+91 9312966129
 sparc.enquiry01@gmail.com


Beginner Guide to Business Intelligence
New to BI? Learn business intelligence basics — core concepts, popular tools, a beginner learning path, and how it differs from data analytics roles.

If you've started exploring a career in data and keep running into the term "BI" without a clear explanation, you're not alone. Business intelligence basics can feel confusing at first, mostly because the term gets used loosely — sometimes to mean a tool, sometimes a job role, sometimes an entire department.
This guide breaks it down clearly: what business intelligence actually means, how it's different from data analytics, the tools you'll encounter, and a simple path to start learning if you're completely new to this.
What Is Business Intelligence, Really?
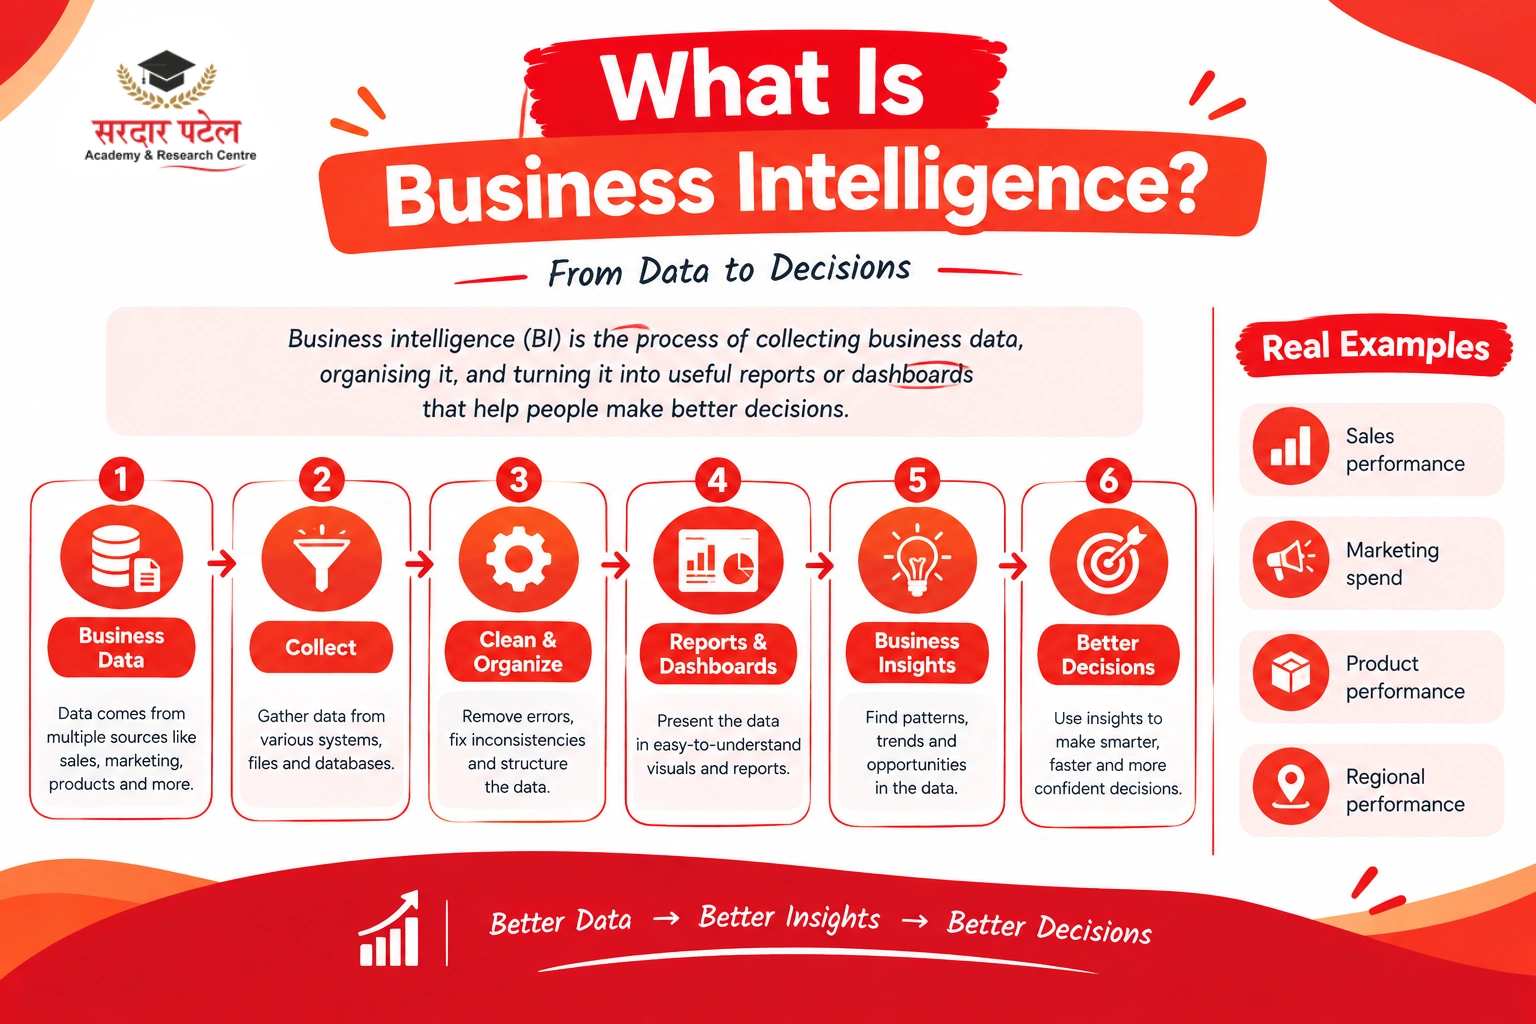
Business intelligence is the process of collecting business data, organising it, and turning it into reports or dashboards that help people make decisions. At its core, it's less about a single tool and more about a workflow — data comes in from multiple sources, gets cleaned and structured, and ends up in a format that a manager or team can actually understand at a glance.
Understanding business intelligence basics starts with recognising this isn't a purely technical exercise. A BI report is only useful if it answers a real business question — "Which product line is underperforming this quarter?" or "Which region needs more marketing spend?" The technical side supports that goal; it isn't the goal itself.
Business Intelligence Basics: The Core Components
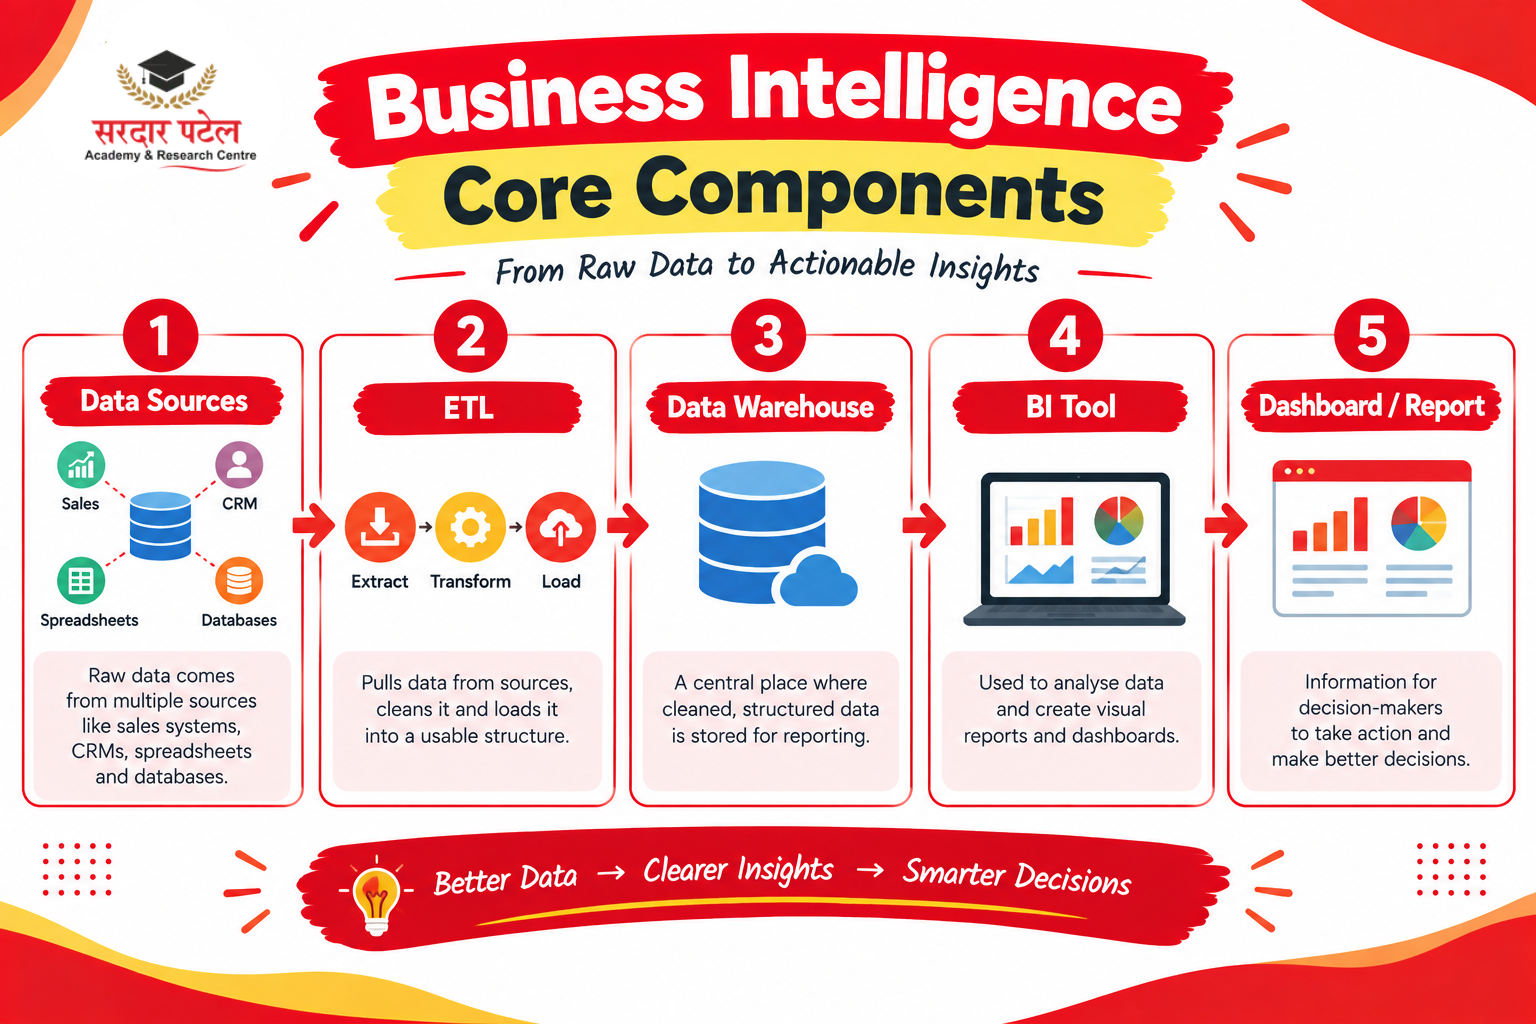
Most BI systems, regardless of company size, are built around a similar set of components.
| Component |
What It Does |
| Data sources |
Raw data from sales systems, CRMs, spreadsheets, or databases |
| ETL (Extract, Transform, Load) |
Pulls data from sources, cleans it, and loads it into a usable structure |
| Data warehouse |
A central place where cleaned, structured data is stored for reporting |
| BI tool |
Software used to build dashboards and visual reports from that data |
| Dashboard/report |
The final output decision-makers actually look at |
For a beginner, you don't need to master every layer immediately. Most entry-level BI roles focus heavily on the BI tool and dashboard layer, with ETL and data warehousing becoming more relevant as you grow into more technical positions.
BI Tutorial for Beginners: Where to Actually Start
If you're looking for a practical bi tutorial for beginners rather than just theory, the honest starting point is Excel, even before touching a dedicated BI tool.
Excel teaches you the underlying logic — organising data into rows and columns, using formulas to summarise it, and building your first basic charts. This foundation makes everything that follows in a BI tool feel far more intuitive, rather than learning an unfamiliar interface and unfamiliar logic at the same time.
Once that foundation feels comfortable, a typical beginner path looks like this:
Once that foundation feels comfortable, a typical beginner path looks like this:
- Get comfortable with structured data — understanding rows, columns, and what makes a dataset "clean" versus messy.
- Learn one BI tool properly rather than sampling several shallowly — depth in one tool transfers more easily to a second tool later than shallow exposure to many.
- Practice on real or realistic datasets, not just tutorial-provided sample files, since real data is messier and teaches you more.
- Build two or three small dashboards that answer a specific business question, even a simple one like tracking monthly expenses.
- Learn basic SQL alongside your BI tool, and understand how SQL and Python skills for analytics can support different types of data work.
Popular BI Tools You Should Know
A few tools come up repeatedly across BI job listings and training programs, each with a slightly different focus. If you're new to analytics tools, this guide to essential data analytics tools can help you understand where each tool fits in the broader analytics workflow.
Power BI holds the leading share of the global BI market and is consistently the most widely adopted platform among the major geographies where BI tools are used — including India, which ranks among Power BI's largest markets outside the US and UK (6sense, 2026; electroiq, 2026). Its integration with Excel and other Microsoft products makes the learning curve gentler for beginners already comfortable with spreadsheets.
Tableau is known for strong, flexible visualisations and is popular in companies with more established analytics teams, though it can feel slightly less intuitive than Power BI for absolute beginners.
Looker Studio (formerly Google Data Studio) is a free, browser-based option often used for marketing and web analytics reporting, and it's a reasonable way to practice dashboard-building without installing any software.
Qlik Sense skews heavily toward enterprise use — industry comparisons consistently position it as an enterprise-grade platform built for governed, large-scale analytics on complex, multi-source datasets, with reviewer data showing its user base is disproportionately made up of large organisations rather than small teams (G2, 2026; The Bricks, 2025). It's generally not the first tool beginners reach for, but it's worth knowing it exists if you see it mentioned in a job description later in your career.
Excel deserves a mention here too, not as a "BI tool" in the strict sense, but because it remains genuinely central to how a lot of smaller businesses actually do reporting, even alongside more advanced tools.
How BI Differs From Data Analytics and Data Science
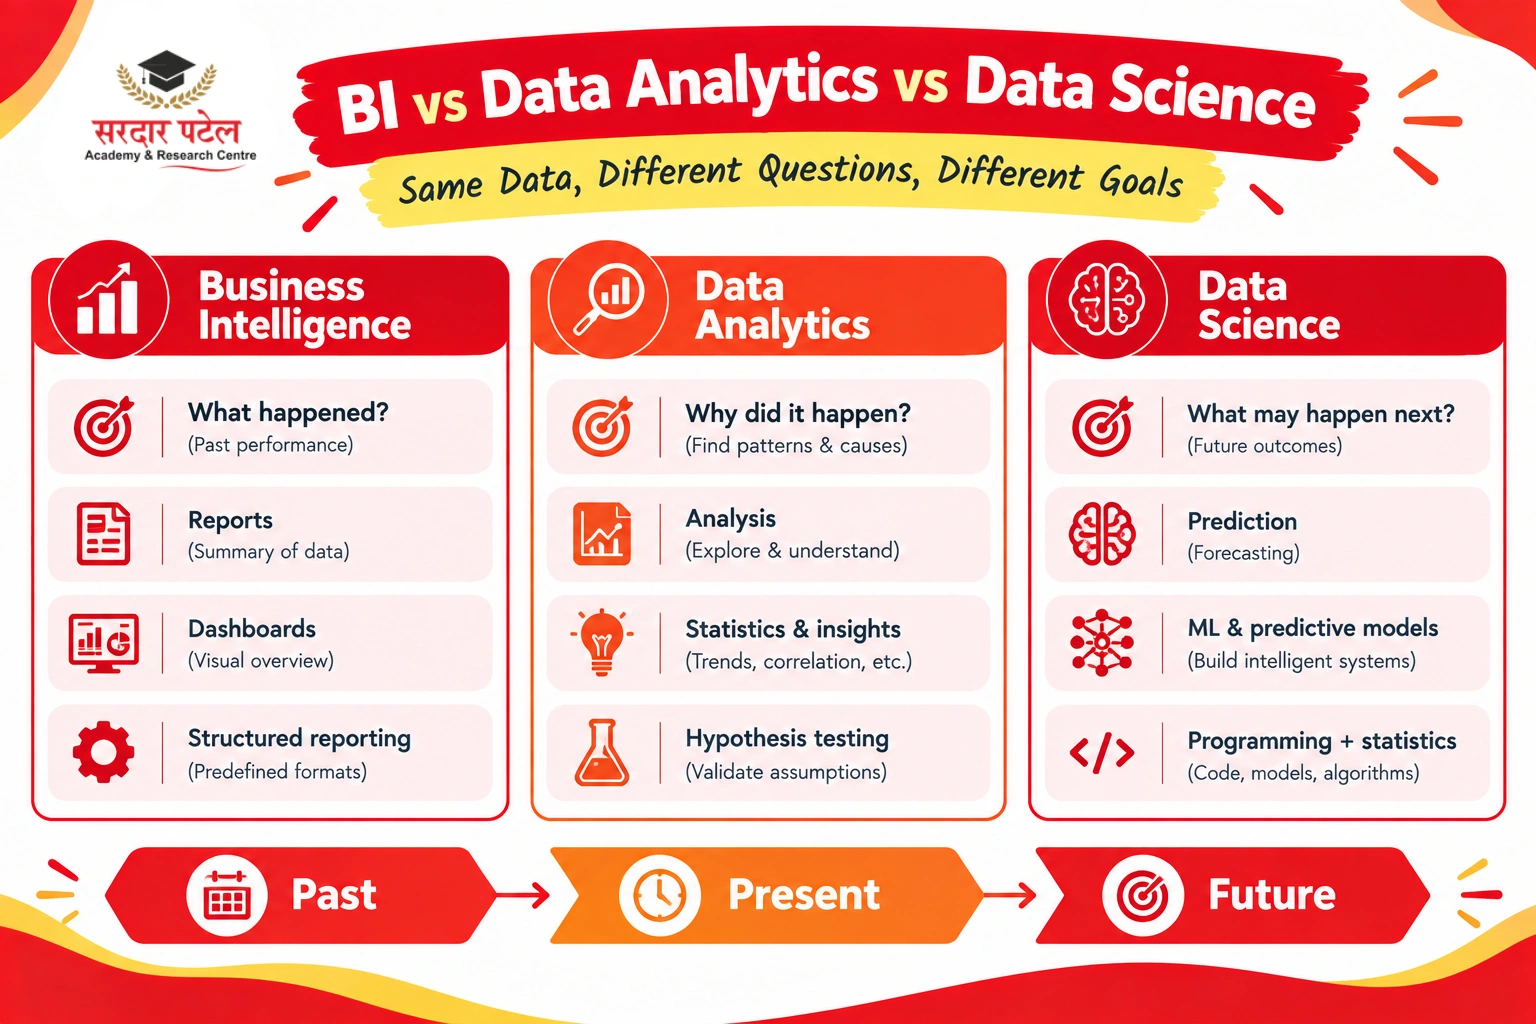
These terms get used almost interchangeably in casual conversation, but they aren't quite the same thing, and understanding the distinction helps you know what a specific job posting is actually asking for.
Business intelligence is primarily about reporting on what has already happened — sales last quarter, website traffic last month — using dashboards and structured reports.
Data analytics overlaps significantly with BI but often goes a step further, digging into why something happened and testing specific hypotheses, sometimes using statistical methods beyond what a standard dashboard shows. If you want a broader introduction to the field, start with this complete overview of data analytics.
Data science typically goes further still, often involving predictive modelling and machine learning to forecast what's likely to happen next, which usually requires stronger programming and statistical skills than most BI or entry-level analytics roles.
In practice, especially at smaller companies, one person often ends up doing a mix of all three, so the boundaries matter less day-to-day than the job description might suggest.
Pros and Cons of Starting Your Career With BI
Before committing significant time to learning business intelligence basics, it's worth weighing what this path actually offers compared to other data-related directions.
Advantages:
- A gentler learning curve than data science. BI tools are generally more visual and less code-heavy, which makes the entry point more approachable for beginners without a programming background.
- High, steady demand across industries. Almost every mid-size or larger company needs someone who can turn raw data into readable reports, regardless of sector.
- Faster path to visible, demonstrable work. A dashboard is easy to show in an interview or portfolio, unlike more abstract technical skills that are harder to showcase quickly.
- Natural overlap with other roles. BI skills transfer well into broader analytics, MIS, or even light project management responsibilities, keeping your options open.
Trade-offs to be aware of:
- Less depth in statistical or predictive work. If your longer-term goal is data science or machine learning, BI alone won't get you there — it's a strong foundation, not a substitute.
- Tool-specific skills can feel narrow. Deep expertise in one BI tool doesn't always transfer immediately to another, so some re-learning is often needed when switching tools.
- Reporting work can become repetitive in roles that are narrowly focused on recurring dashboards rather than varied analytical problems.
None of these trade-offs make BI a weak starting point — they're simply worth knowing upfront so your expectations match the actual day-to-day of the role.
Common Mistakes Beginners Make
- Jumping straight into an advanced BI tool without first understanding how to structure and clean data properly, which makes every subsequent step harder than it needs to be.
- Learning tool features in isolation — knowing every chart type in Power BI doesn't help much if you can't decide which business question a given chart should actually answer.
- Treating dashboards as decoration rather than decision-making tools, cramming in every possible metric instead of focusing on what the viewer actually needs to see.
- Skipping SQL entirely, assuming a BI tool's built-in data connectors are enough, when real workplace data often lives in a database that needs a direct query.
- Not practising on messy, real-world data, which means the first time you encounter genuinely inconsistent data is on the job rather than during practice.
A Simple Learning Path
Here's a practical sequence for someone starting from zero, assuming consistent, regular practice rather than occasional study sessions. For a more detailed roadmap, you can also follow this step-by-step data analytics learning guide.
Weeks 1–3: Build solid Excel fundamentals — formulas, pivot tables, and basic charting, since this underlies almost everything that follows.
Weeks 4–6: Learn one BI tool (Power BI is a reasonable default for most beginners in India) — focus on connecting data sources, building visuals, and building Power BI dashboards step by step
Weeks 7–8: Add basic SQL — enough to query and filter data from a simple database, since this connects your BI tool to real, larger datasets.
Weeks 9–12: Build two or three complete dashboard projects using realistic data, documenting the business question each one answers and why you made specific design choices.