+91 9312966129
 sparc.enquiry01@gmail.com


Can Commerce Students Learn Data Analytics?
Yes! Commerce students can build high-paying data analytics careers. Learn the exact tools, roadmap, salaries & job roles for BCom graduates in 2026.
Table of Contents
- Why Data Analytics Is the Smartest Career Move for Commerce Students in 2026
- Natural Advantages Commerce Students Bring to Analytics
- What Is Data Analytics? (Simple Explanation for Commerce Students)
- A Real-World Example
- Is Coding Mandatory for Commerce Students in Data Analytics?
- Skills Commerce Students Need to Become Data Analysts
- 1. Excel — Your Starting Point
- 2. SQL — Your Most Valuable Early Skill
- 3. Power BI or Tableau — Data Visualisation
- 4. Business Statistics
- 5. Python — Optional but High-Value
- Real Success Stories: BCom Students Who Made the Transition
- Step-by-Step Learning Roadmap for Commerce Students (0 to Job-Ready)
- Career Opportunities After BCom: Analytics Roles You Can Target
- Industries Actively Hiring Commerce Students for Analytics
- Salary Expectations for Commerce Graduates in Data Analytics (2026 Data)
- Common Myths About Data Analytics for Commerce Students — Busted
- Tips to Succeed as a Commerce Student Entering Analytics
- Future Scope of Data Analytics in India (2026–2030)
- Conclusion
- Ready to Start Your Analytics Career?
Many commerce students believe data analytics is only for engineering graduates. That belief is costing them high-paying careers. The truth is that your BCom background is actually an advantage — businesses need analysts who understand both data and business operations. This guide shows you exactly how to make that transition in 2026.
The demand for data analysts across finance, banking, e-commerce, retail, and healthcare is growing faster than the supply. Leading banks, e-commerce platforms, consulting firms, and telecom players like Jio actively hire commerce graduates for analytics roles — not despite their background, but because of it.
In this guide, you will learn: what skills you actually need, a step-by-step learning roadmap, realistic salary expectations backed by data, and how real BCom students have successfully made this transition.
Why Data Analytics Is the Smartest Career Move for Commerce Students in 2026
The Indian analytics and data science market is projected to reach ₹1,39,000 crore by 2026, growing at over 26% annually (Source: NASSCOM, 2024). Yet there is a significant talent shortage — companies cannot find enough professionals who combine business understanding with analytical skills.
This is exactly where commerce students have an edge over pure technology graduates.
Natural Advantages Commerce Students Bring to Analytics
- Financial literacy: Reading P&L statements, balance sheets, and cash flow reports — skills most engineers lack
- Business context: You already understand how businesses make money, control costs, and serve customers
- Statistical foundation: Business statistics and economics from your BCom curriculum directly apply
- Analytical thinking: Accountancy and auditing train you to find errors, spot patterns, and verify data.
- Communication skills: Presenting data insights to non-technical stakeholders is a skill that commerce students naturally develop
Key Insight: A survey of 200 analytics hiring managers (LinkedIn Talent Insights, 2024) found that 67% preferred candidates with domain business knowledge over those with only technical skills for business analyst and reporting roles
What Is Data Analytics? (Simple Explanation for Commerce Students)
Data analytics is the process of collecting, organising, analysing, and interpreting data to help businesses make better decisions and solve real problems.
A Real-World Example
Imagine you work for a retail chain. Sales in the Delhi stores are 30% lower than in Mumbai. A data analyst would pull transaction data, segment it by product category, day of week, and customer age group, then identify the exact reason — perhaps a competing store opened nearby, or a specific product category is underperforming. That analysis saves the business lakhs of rupees in guesswork.
In simple terms, data analytics helps businesses answer questions like:
- Which products are most profitable, and why?
- Which customer segments are churning?
- What marketing channel gives the best ROI?
- Where are operations losing money
- What will sales look like next quarter?
Notice that each of these questions requires business understanding first and technical tools second. That is why commerce students are so well-suited for this field.
Is Coding Mandatory for Commerce Students in Data Analytics?
This is the most common concern — and the good news is clear: you do not need to code to get your first analytics job
Want to know how professionals build a successful Data Analytics Career Without Coding? Read our detailed guide to understand beginner-friendly career paths, essential skills, and job opportunities without programming.
The majority of entry-level data analyst and business analyst roles in India require only Excel, SQL, and one visualisation tool. SQL is the closest thing to coding you will need initially, but it reads almost like plain English, and most commerce students learn it within 3–4 weeks of consistent practice.
| Tool |
Purpose |
Difficulty for BCom Students |
Time to Learn |
| Excel / Google Sheets |
Data analysis, reporting, dashboards |
Very Easy |
2–3 weeks |
| SQL |
Querying & managing databases |
Easy |
3–5 weeks |
| Power BI |
Interactive dashboards & visual reports |
Easy |
3–4 weeks |
| Tableau |
Advanced data visualization |
Easy-Medium |
4–5 weeks |
| Python (Pandas, NumPy) |
Advanced analytics & automation |
Medium |
6–10 weeks |
Time estimates are based on 1–2 hours of practice per day.
Python is valuable and will increase your salary potential significantly, but you can learn it after landing your first job. Many working analysts pick it up on the job.
Skills Commerce Students Need to Become Data Analysts
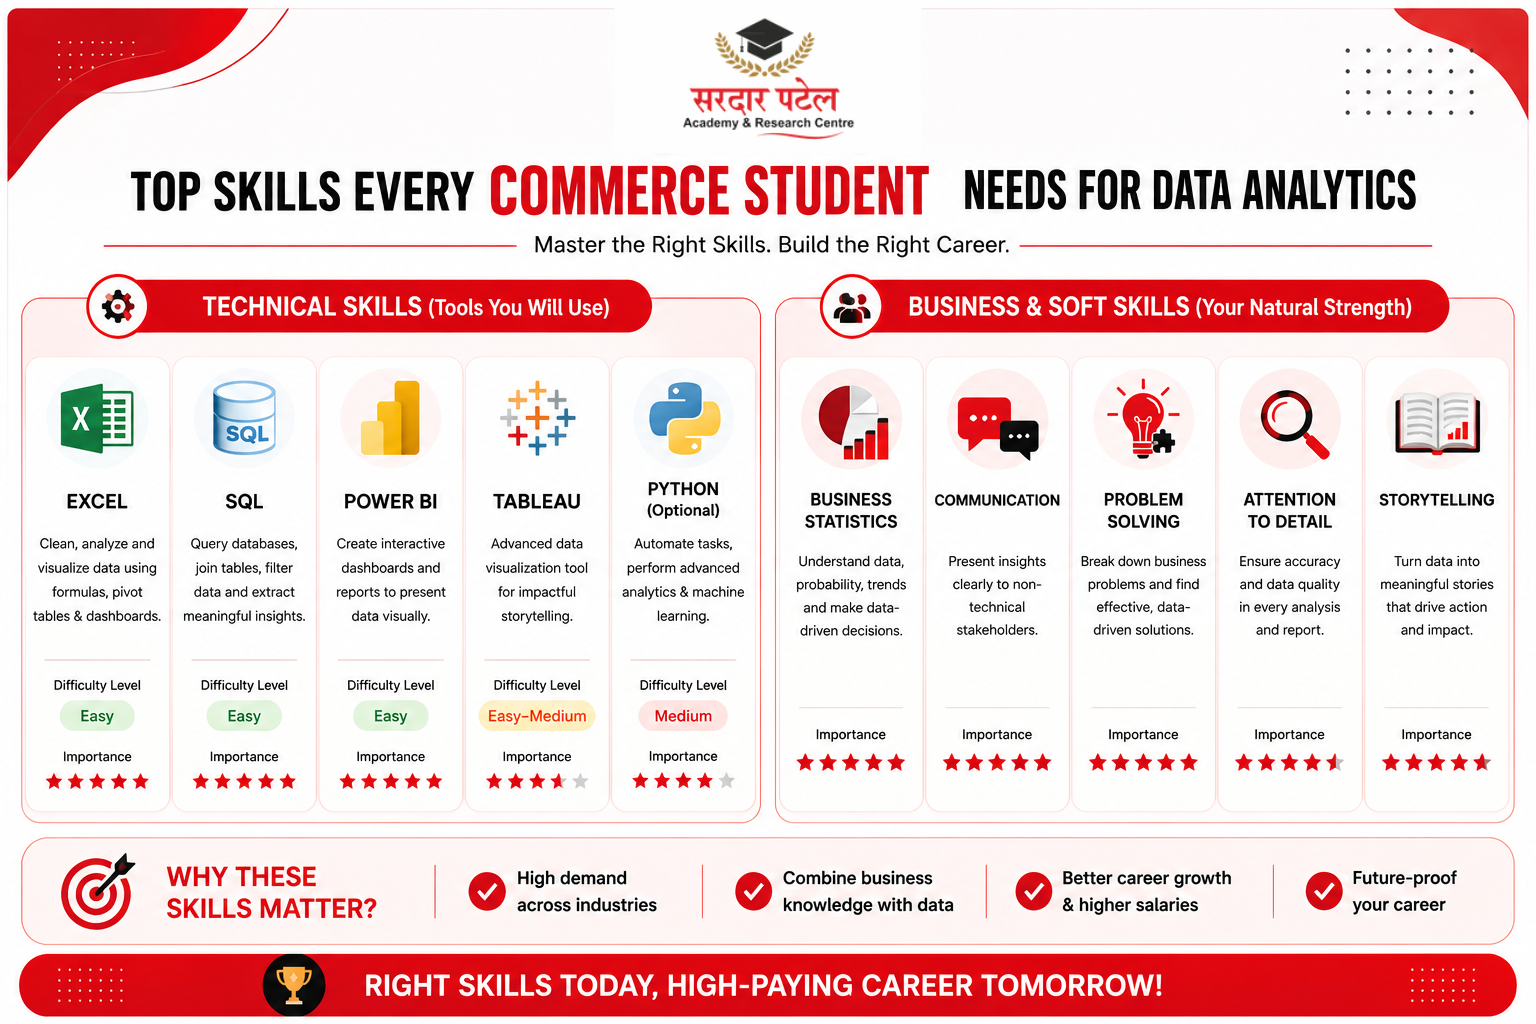
1. Excel — Your Starting Point
Excel is still the most widely used analytics tool in Indian companies, especially in banking, finance, and FMCG sectors. Master these specific areas:
- Pivot Tables and Pivot Charts — for summarising large datasets instantly
- VLOOKUP, INDEX-MATCH, XLOOKUP — for combining data from multiple sheets
- Data validation and conditional formatting — for clean, professional reports
- Dashboard creation — arranging charts and KPIs for management reporting
- Power Query — for automating data cleaning (a game-changer for speed)
2. SQL — Your Most Valuable Early Skill
SQL lets you pull exactly the data you need from company databases. In most analytics jobs, 40–60% of your daily work involves writing SQL queries. The good news: basic SQL can be learned in under a month.
- SELECT, WHERE, GROUP BY, ORDER BY — for filtering and summarising data
- JOINs — for combining information from multiple tables
- Aggregate functions (SUM, COUNT, AVG) — for business calculations
- Subqueries — for more complex analysis
3. Power BI or Tableau — Data Visualisation
Raw data in spreadsheets does not convince decision-makers. Visualisation tools help you create interactive dashboards that tell a clear business story. Power BI is recommended for beginners — it integrates with Excel data naturally and is widely used in Indian companies.
4. Business Statistics
You likely already covered some of this in your BCom curriculum. Focus on practical application:
- Mean, median, mode — understanding central tendency in business data
- Standard deviation — spotting unusual patterns and outliers
- Correlation — understanding which business variables move together
- Basic probability — for forecasting and risk assessment
- Hypothesis testing — for A/B testing in marketing or product decisions
5. Python — Optional but High-Value
Once you are comfortable with the above, Python opens doors to automation, machine learning, and significantly higher salaries. Key libraries: Pandas (data manipulation), NumPy (numerical analysis), and Matplotlib/Seaborn (charting).
Soft Skills That Set Commerce Students Apart
- Business storytelling: Translating data findings into clear business recommendations
- Stakeholder communication: Presenting insights to finance heads and managers confidently
- Attention to detail: Catching data errors before they reach decision-makers
- Problem framing: Turning a vague business question into a measurable analytics task
Real Success Stories: BCom Students Who Made the Transition
Case Study 1: Rohit V.* — BCom Graduate to Financial Data Analyst at a Leading Private Bank
Rohit completed his BCom from Delhi University in 2022 with no prior coding knowledge. He spent 5 months learning Excel, SQL, and Power BI through online courses and free datasets from Kaggle. His final project was a Credit Risk Dashboard built using public banking data — directly relevant to his target industry. He landed a role as a Reporting Analyst at a leading private bank at ₹5.2 LPA within 6 months of starting his analytics learning journey. By 2024, after learning Python on the job, his CTC had grown to ₹9 LPA.
"My BCom knowledge made me understand the banking data better than my engineering colleagues. I knew what a CAR ratio meant and why NPAs mattered. That business context is what got me the job." — Rohit V.*
Case Study 2: Neha A.* — BCom (Hons) to Business Analyst at a Leading E-Commerce Company
Neha graduated with a BCom (Hons) from a reputed Delhi University college and wanted to enter the e-commerce sector. She focused on consumer behaviour analysis — building a project tracking customer purchase patterns using a public e-commerce dataset. After 4 months of focused learning, she joined a leading e-commerce company's analytics team as a Junior Business Analyst at ₹4.8 LPA. Her understanding of retail economics and customer lifetime value gave her an edge over engineering applicants in the interview.
*Names changed for privacy.
Step-by-Step Learning Roadmap for Commerce Students (0 to Job-Ready)
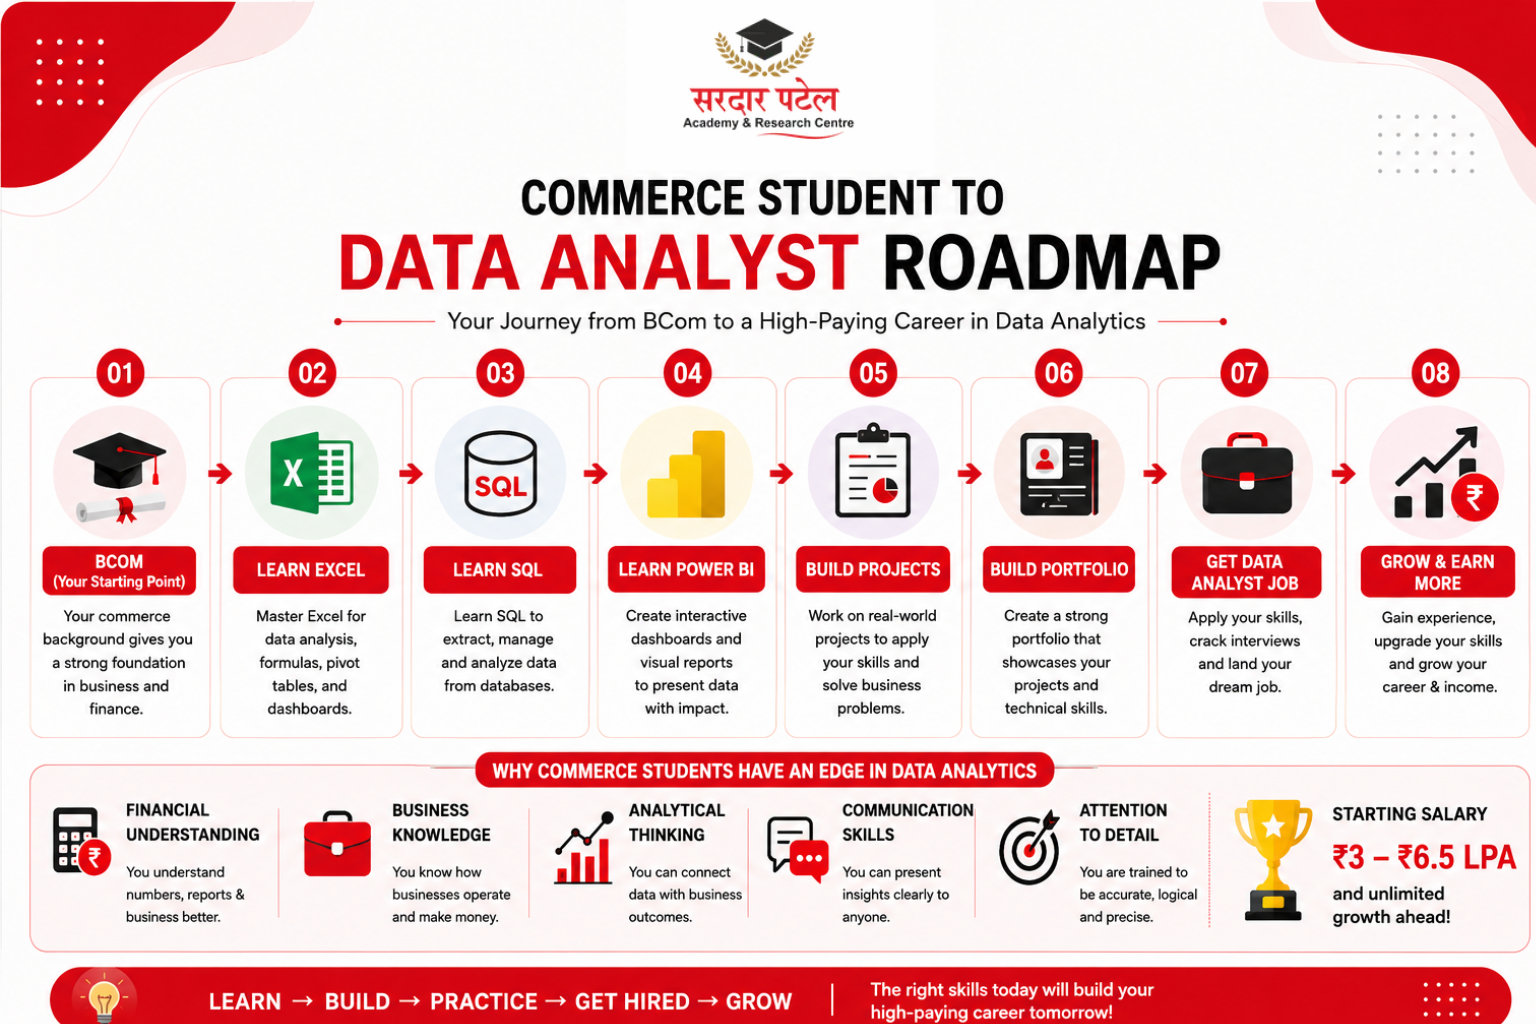
Follow this 5-month roadmap consistently, investing 1.5–2 hours per day:
If you're planning to start even earlier, you can begin learning analytics after school itself. Read our guide on Which Data Analytics Certification is Provided? to understand the eligibility, learning path, and career opportunities available after Class 12.
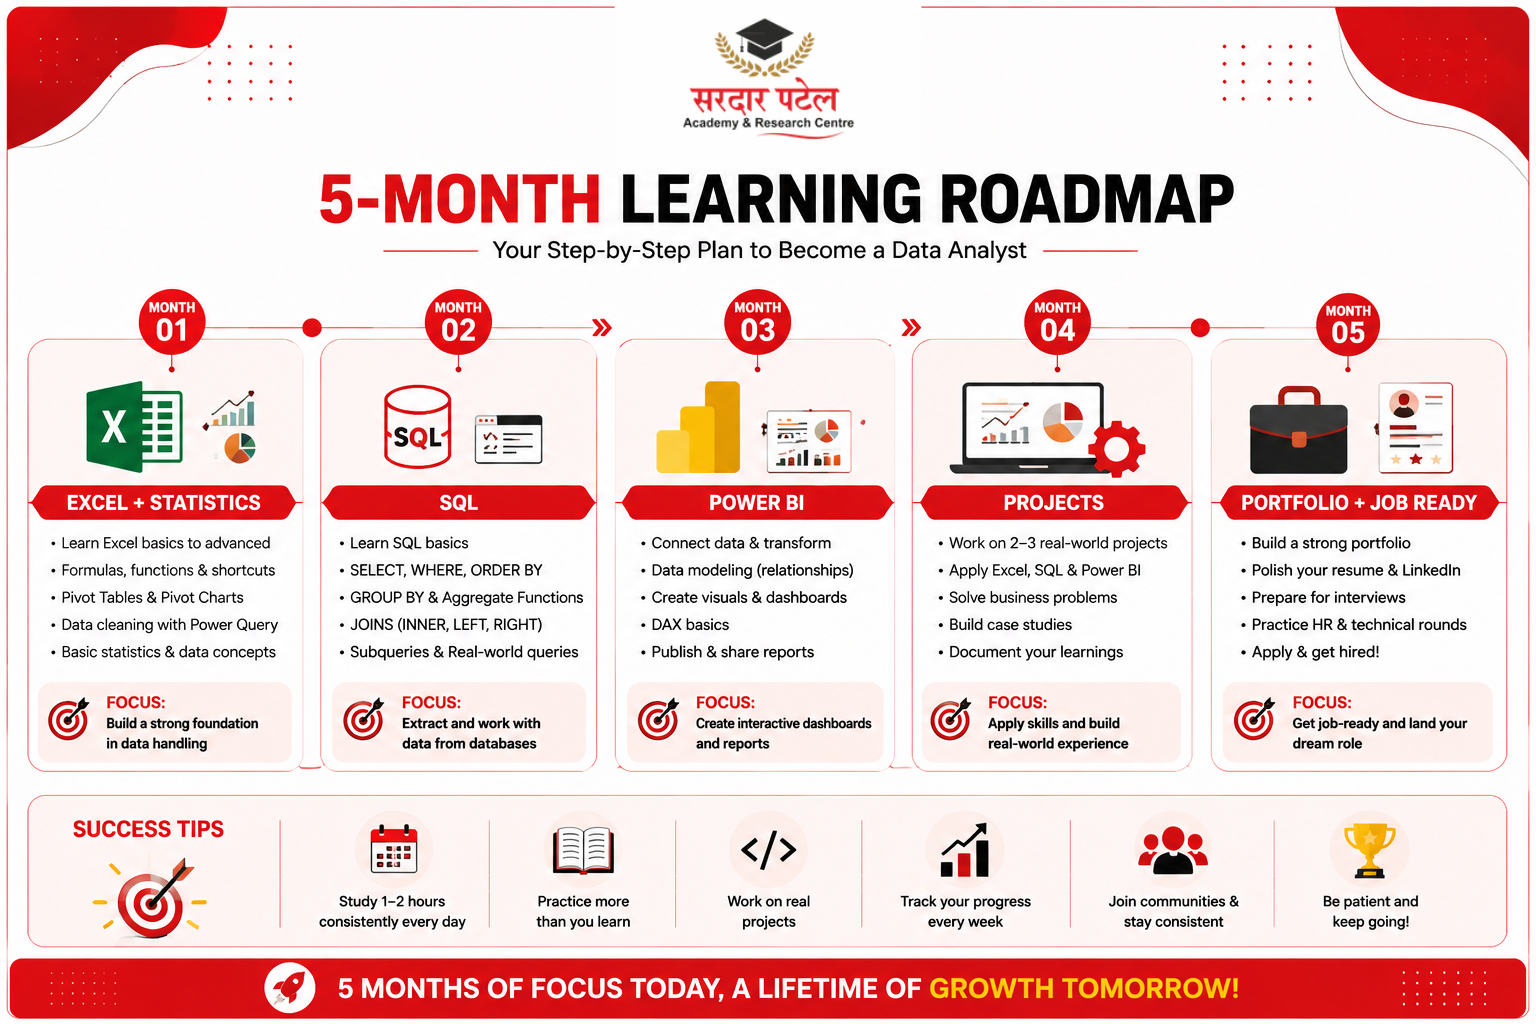
Month 1 — Master Excel & Business Statistics: Complete all Excel functions, pivot tables, dashboards, and Power Query basics. Refresh business statistics (mean, median, correlation). Practice on 2–3 free datasets from Kaggle or data.gov.in. Goal: build a sales analysis dashboard.
Month 2 — Learn SQL (Focus: Practical Querying): Use free platforms like SQLZoo, Mode Analytics, or LeetCode (easy SQL problems). Practice SELECT, JOINs, GROUP BY, and subqueries. Goal: solve 30+ SQL problems and write 10 real business queries.
Month 3 — Power BI / Tableau + Connecting Tools: Learn to connect SQL databases and Excel files to Power BI. Build 2–3 interactive dashboards. Focus on storytelling — what does each visual communicate? Goal: build a complete financial or sales performance dashboard.
Month 4 — Real-World Projects (This Is What Gets You Hired): Build 2 domain-specific projects using public data. Suggested ideas: Customer Churn Analysis for a telecom company, Sales Trend Analysis for an FMCG brand, or a Loan Default Risk Dashboard for a bank. Document your process and findings clearly.
Month 5 — Portfolio, LinkedIn & Job Applications: Upload projects to GitHub with detailed README files. Create a LinkedIn profile highlighting your skills, tools, and projects. Start applying for internships and entry-level roles. Prepare for common interview questions (SQL challenges, dashboard case studies, business problem scenarios).
Pro Tip: Choose projects in the industry you want to work in. If you want to work in banking, build a credit analysis dashboard. If retail is your target, build a customer segmentation project. Recruiters notice domain relevance immediately.
Following a structured learning program can help you master Excel, SQL, Power BI, and Python more efficiently. Explore our Data Analytics Course to gain hands-on training, live projects, and career guidance.
Career Opportunities After BCom: Analytics Roles You Can Target
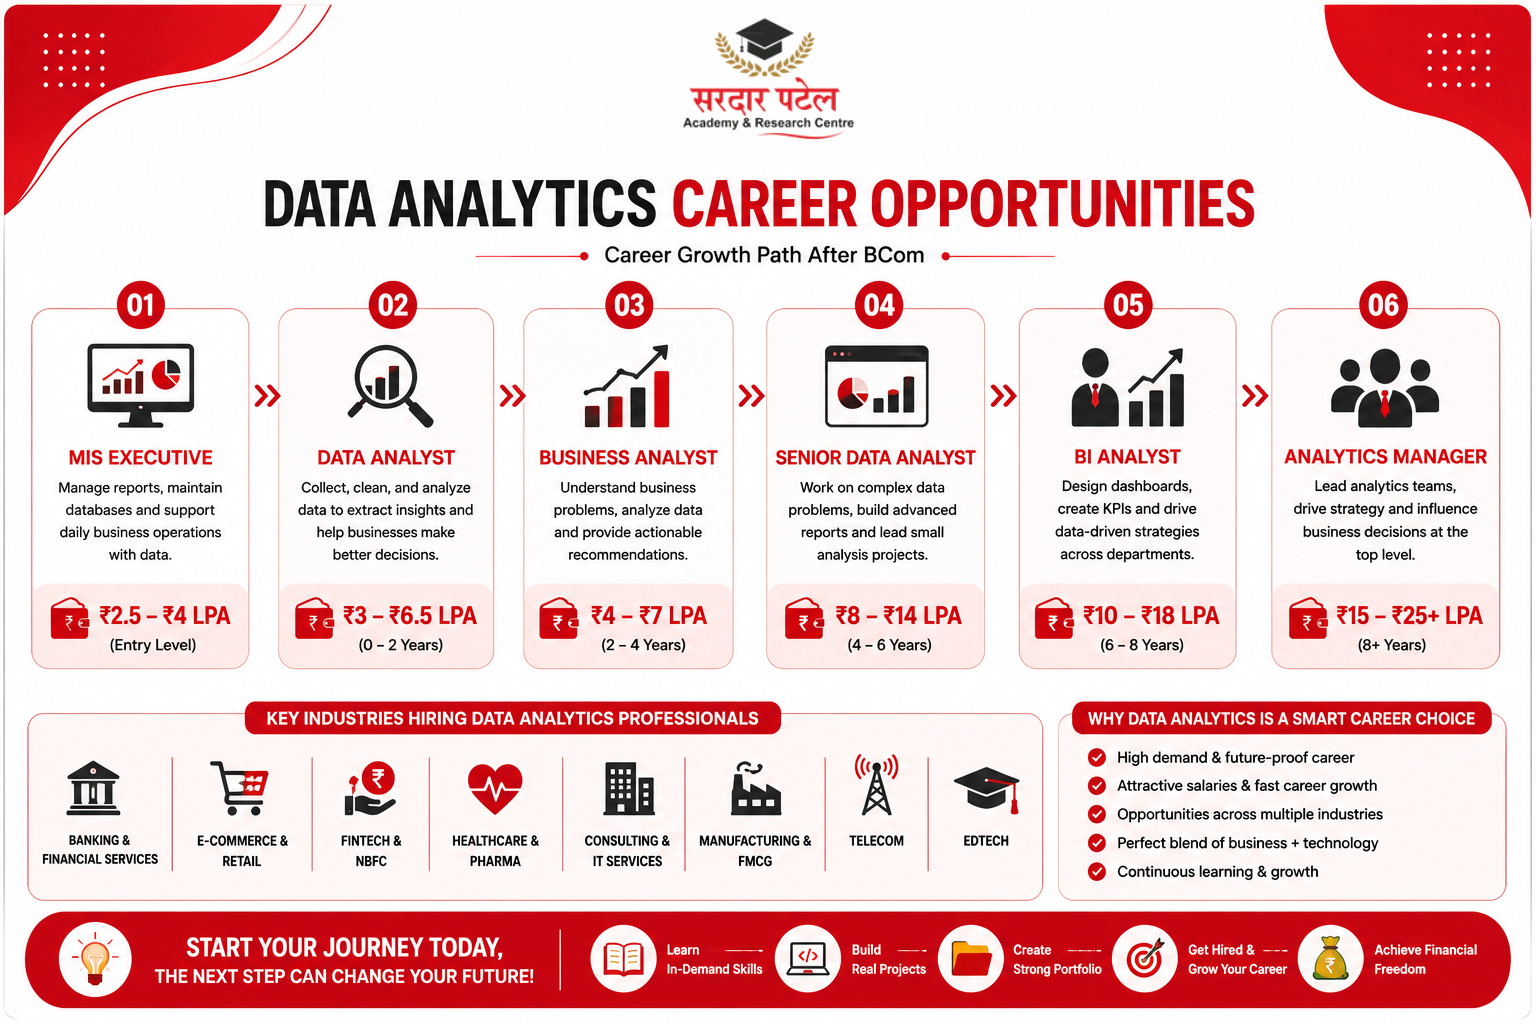
Entry-Level Roles (0–2 Years Experience)
| Job Title |
What You Will Do |
Average Salary (2026) |
| Data Analyst |
Analyse business data, create reports, and identify trends |
₹3.5 – ₹6.5 LPA |
| Business Analyst |
Bridge between data and business decisions |
₹4 – ₹7 LPA |
| IS Executive / Analyst |
Manage reporting systems and daily dashboards |
₹3 – ₹5.5 LPA |
| Financial Data Analyst |
Combine finance domain knowledge with analytics |
₹4 – ₹7.5 LPA |
| Reporting Analyst |
Build dashboards and reports for leadership |
₹3.5 – ₹6 LPA |
If you want to explore the latest Can I Earn While Learning Data Analytics? including eligibility, required skills, hiring industries, and career growth, check out our complete career guide.
Source: Naukri.com Salary Insights & AmbitionBox, 2024–2025 average ranges.
Growth Path (3–7 Years)
- Senior Data Analyst — ₹8–14 LPA
- Business Intelligence Analyst — ₹10–18 LPA
- Analytics Manager — ₹15–25 LPA
- Product Analyst — ₹12–22 LPA
- Data Science Roles (with Python/ML) — ₹15–30+ LPA
Industries Actively Hiring Commerce Students for Analytics
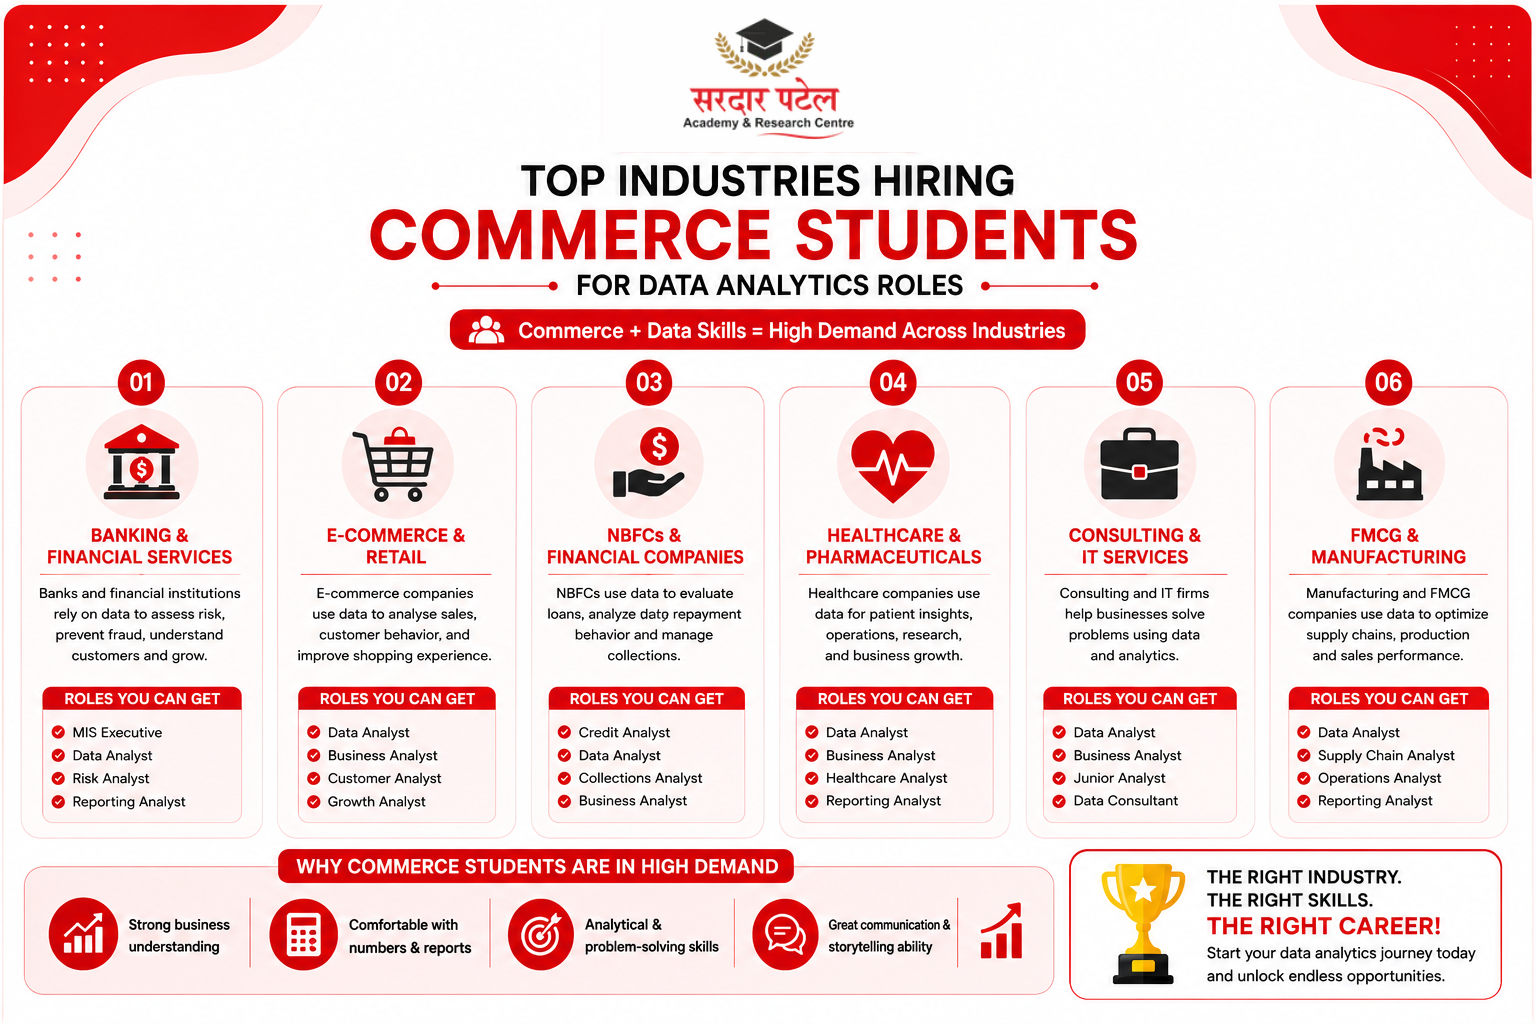
- Banking & NBFC: Credit risk, loan analytics, regulatory reporting (ICICI, Bajaj Finserv)
- Insurance: Claims analytics, customer lifetime value, fraud detection
- E-commerce & Retail: Sales analytics, customer segmentation, inventory forecasting (Meesho)
- Consulting: Client data analysis, business performance benchmarking (PwC, EY)
- Healthcare: Revenue cycle analytics, operational reporting
- FMCG & Manufacturing: Supply chain analytics, demand forecasting
Salary Expectations for Commerce Graduates in Data Analytics (2026 Data)
| Experience Level |
Average Annual CTC | Key Skills That Push to the Upper Range |
| Fresher (0–1 year) |
₹3 LPA – ₹6.5 LPA |
SQL + Power BI + domain-specific project |
| Junior (1–3 years) |
₹5.5 LPA – ₹9LPA |
Python basics + strong storytelling skills |
| Mid-level (3–5 years) |
₹9 LPA – ₹16 LPA |
Team leadership + advanced SQL + Python |
| Senior (5–8 years) |
₹16 LPA – ₹28 LPA |
Stakeholder management + ML exposure |
| Manager / Lead (8+ years) |
₹25 LPA – ₹45+ LPA |
Strategy, cross-functional leadership |
Source: Naukri.com Salary Insights, AmbitionBox, and LinkedIn Salary Data — India average, 2025.
📊 City Impact on Salary: Bangalore, Mumbai, and Hyderabad typically offer 20–35% higher salaries for analytics roles compared to Tier-2 cities. Remote roles are also increasingly available, often at metro-equivalent pay.
Common Myths About Data Analytics for Commerce Students — Busted
| ❌ Myth |
✅ Reality |
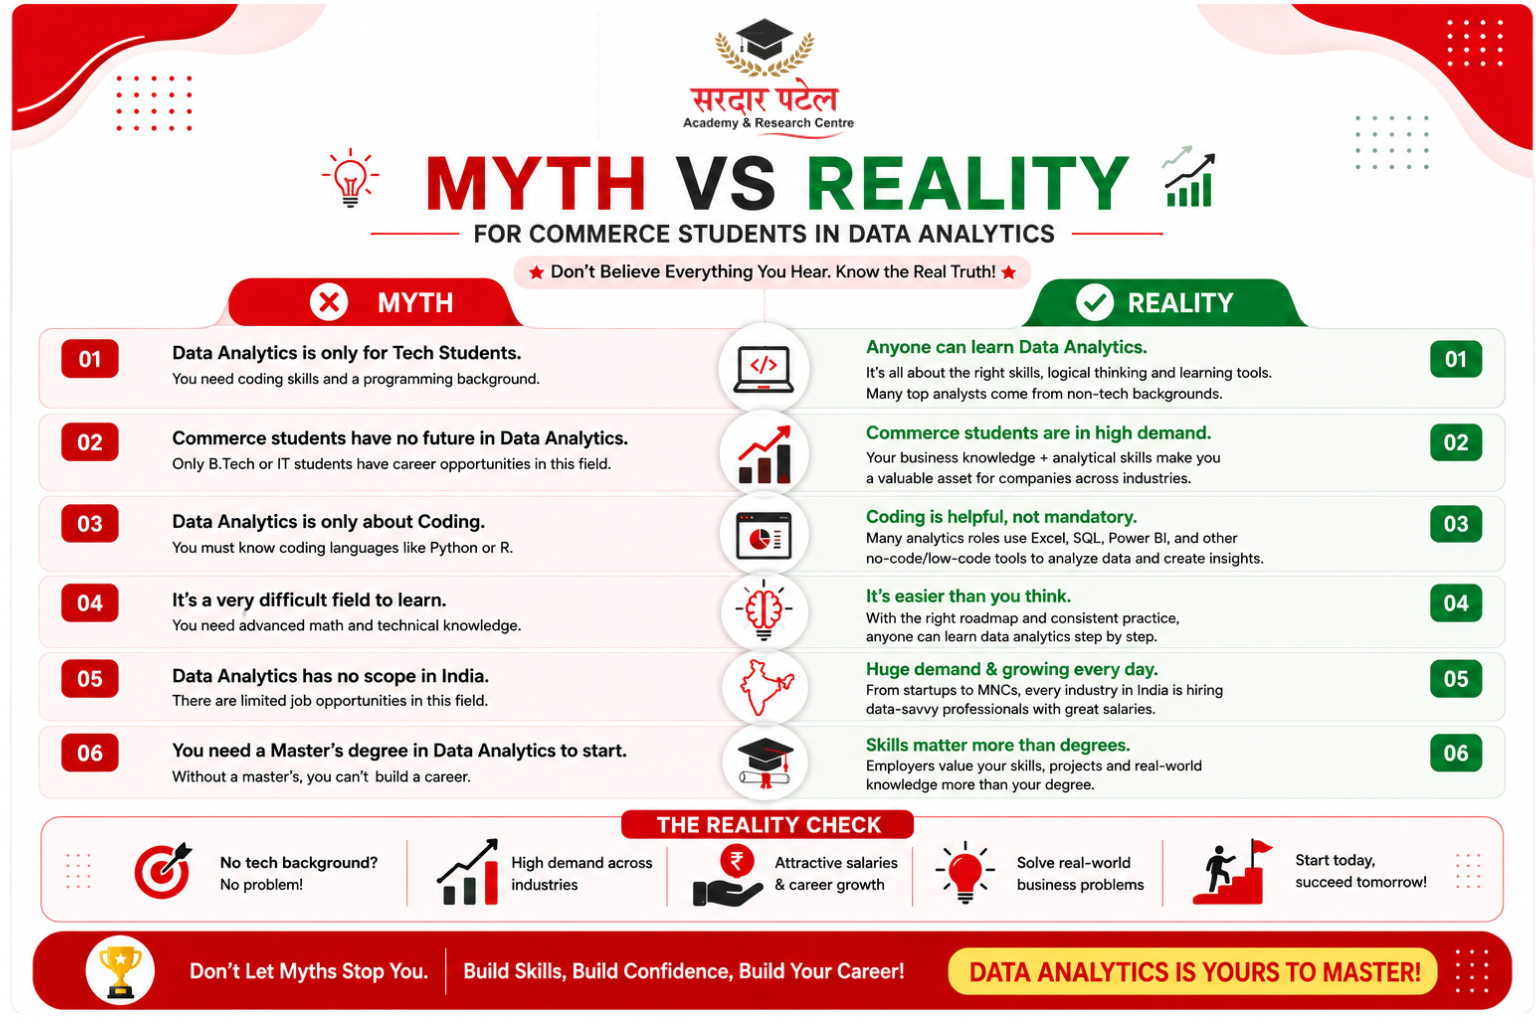
| Only engineering and CS graduates can become data analysts. |
Thousands of BCom, BA, and BMS graduates work as data analysts at top companies. Domain knowledge often matters more than a coding degree. |
| You need to be very strong in mathematics. |
Business statistics — which you likely studied in BCom — is sufficient for most analyst roles. Advanced maths is only needed for data science / ML positions. |
| You must learn Python before applying for any analytics job. |
Over 60% of entry-level analytics job listings in India list Excel + SQL + Power BI as the core requirements. Python is a bonus at entry level. (Source: Naukri.com, 2024) |
| Data analytics is not only about technology and tools. |
The hardest part of analytics is asking the right business question — not running the SQL query. Business understanding is the actual differentiator. |
Tips to Succeed as a Commerce Student Entering Analytics
- Start with one tool at a time. Jumping between Excel, SQL, Python, and Tableau simultaneously leads to shallow knowledge in all. Depth beats breadth at the start.
- Use real-world data, not toy datasets. Download actual datasets from Kaggle, data.gov.in, or RBI's public data portal. Real messy data teaches you more than clean practice datasets.
- Build projects in your target industry. A banking-focused candidate who submits a credit analysis dashboard will always beat a generic candidate.
- Document your thinking, not just your code. Write clear problem statements and business conclusions for every project. This is what interviewers evaluate.
- Network actively on LinkedIn. Connect with data analysts, follow analytics leaders, comment on their posts, and share your project updates. Referrals fill 40–60% of analytics vacancies.
- Target internships aggressively. Even a 2-month unpaid internship creates a massive credibility advantage over candidates with zero work experience.
- Learn to present, not just analyse. Practice explaining your findings in 2–3 clear sentences that a non-technical manager can understand. This skill alone will set you apart in interviews.
Future Scope of Data Analytics in India (2026–2030)
The outlook for analytics professionals in India is exceptionally strong. The NASSCOM–Deloitte Future of Work report (2024) estimates that India will need over 11 million data professionals by 2026, with a current supply gap of more than 2 million qualified candidates.
Emerging specialisations that commerce graduates are well-positioned for:
- Financial Analytics: Risk modelling, regulatory reporting (RBI, SEBI compliance data), fraud detection
- Customer Analytics: Churn prediction, lifetime value modelling, segmentation
- Business Intelligence: Executive dashboards, KPI frameworks, automated reporting
- Retail and E-commerce Analytics: Pricing optimisation, inventory forecasting, campaign performance
- Healthcare Revenue Analytics: Billing optimisation, patient flow analysis
Additionally, roles in Generative AI for Business — using AI tools to automate reports and generate insights — are emerging rapidly. Commerce students with analytics training are uniquely positioned to work at the intersection of AI tools and business decision-making.
Conclusion
The growing demand for data-driven decision-making has created exciting opportunities for students from all educational backgrounds. Data analytics for commerce students is no longer just a possibility — it is one of the most rewarding career paths available today.
Commerce students already possess valuable business knowledge, financial understanding, and analytical thinking skills. By learning tools such as Excel, SQL, Power BI, and basic statistics, they can confidently enter the analytics industry and build successful careers.
Whether your goal is to become a Data Analyst, Business Analyst, Financial Analyst, or Business Intelligence professional, the opportunities are vast and expanding every year. If you are looking for a future-ready profession with strong salary potential and career growth, analytics is an excellent choice.
Ready to Start Your Analytics Career?
Join our industry-designed analytics program built specifically for commerce graduates — offered by Sardar Patel Academy & Research Centre (SPARC).
Learn Excel, SQL, Power BI, and Python with real business projects and dedicated placement support.
⭐ 4.7/5 rating (Google Reviews) · Part of SPARC — 20+ years of training experience · 7,500+ students placed across Delhi NCR
FAQs
Yes. Commerce students already possess business knowledge and analytical thinking that directly apply to analytics roles. Starting with Excel and SQL — both learnable without any prior technical background — most BCom students become job-ready within 4 to 6 months of consistent, structured practice.
Not at the entry level. Most beginner analytics roles in India require Excel, SQL, and a visualization tool like Power BI or Tableau. SQL is the closest thing to coding you will need initially, and it is far simpler than Python or Java. Python becomes valuable after 1–2 years of experience and can significantly increase your salary.
Fresh BCom graduates entering data analytics typically earn between ₹3 LPA and ₹6.5 LPA, depending on the company, city, and skills. Candidates with strong SQL, Power BI, and a domain-relevant portfolio project tend to receive offers at the higher end. With 2–3 years of experience, salaries typically reach ₹8–12 LPA. (Source: Naukri.com Salary Insights, 2024–25)
Most commerce students become job-ready within 4 to 6 months by investing 1.5–2 hours per day. The fastest path is: Excel (Month 1) → SQL (Month 2) → Power BI (Month 3) → Real-world projects (Month 4) → Job applications (Month 5). Consistency matters far more than the number of courses you enroll in.
Banking and NBFC, insurance, retail and e-commerce, consulting, FMCG, healthcare, and EdTech sectors actively recruit commerce graduates for data analyst, business analyst, MIS analyst, and financial analyst roles. Banks and consulting firms particularly value commerce graduates because of their financial literacy and business communication skills.
A BCom degree combined with analytics skills and a strong project portfolio is sufficient to get hired at most Indian companies for entry-level roles. You do not need an MBA or MCA. However, relevant certifications — such as Microsoft Power BI Certification, Google Data Analytics Certificate, or a structured analytics course — do strengthen your profile significantly.
Start with Microsoft Excel. It builds the foundation for data thinking — how to clean, organize, and summarize data, create pivot tables, and build basic dashboards. Once you are confident in Excel, move to SQL. Together, these two tools qualify you for a large percentage of entry-level analytics job listings in India.
Yes — the Indian market has strong demand for fresher data analyst, reporting analyst, and MIS executive roles. Companies like TCS, Infosys, Wipro, Axis Bank, and many startups actively hire freshers with analytics skills. The key differentiator is having at least one real project in your portfolio and demonstrated SQL proficiency.