+91 9312966129
 sparc.enquiry01@gmail.com


Data Analytics Career Without Coding
Can you build a data analytics career without coding? Yes. Discover the exact tools, skills, job roles, salaries, and step-by-step roadmap to start your data analytics career without coding in 2026.
Table of Contents
- You Do Not Need to Code to Work in Data Analytics
- Can You Really Build a Data Analytics Career Without Coding?
- Can Non-Technical Students Learn Data Analytics?
- Why Companies Are Actively Hiring Non-Technical Data Analysts
- Essential Skills for a Data Analytics Career Without Coding
- 1. Microsoft Excel — The Foundation of Every Analytics Role
- 2. Power BI — The Most In-Demand Dashboard Tool in India
- 3. Tableau — Visual Storytelling for Business Data
- 4. Google Looker Studio — Free Tool for Marketing and Digital Analytics
- 5. Business Analysis and Domain Knowledge
- 6. Statistics Fundamentals — No Advanced Math Required
- 7. Communication and Data Storytelling
- Best No-Code and Low-Code Analytics Tools for Beginners
- Job Roles Available in Data Analytics Without Coding
- Data Analyst (Entry Level)
- Business Analyst
- Reporting Analyst / MIS Executive
- Marketing Analyst
- Financial Analyst (Junior)
- Operations Analyst
- Step-by-Step Roadmap: How to Start a Data Analytics Career Without Coding
- Salary Expectations for Data Analytics Without Coding
- Common Myths About Data Analytics Careers — Debunked
- Future Scope of Data Analytics in 2026 and Beyond
- Conclusion: Your Data Analytics Career Without Coding Starts Today
You Do Not Need to Code to Work in Data Analytics
If you have been holding back from exploring a data analytics career without coding because you think programming is mandatory, this guide will change your mind.
The belief that every data analyst must know Python or SQL stops thousands of capable students and professionals from entering one of the fastest-growing fields in the world. The truth is that a large portion of entry-level and mid-level data analytics roles focus entirely on business understanding, reporting, dashboard creation, and data interpretation — not software development data analytics basics for beginners.
Modern platforms like Microsoft Excel, Power BI, Tableau, and Google Looker Studio have made it possible for anyone to start a data analytics career without coding. These tools are built for business users, not engineers. They use drag-and-drop interfaces, visual dashboards, and point-and-click functionality that require zero programming knowledge.
In 2026, the demand for data-driven decision-making will grow across every sector — banking, healthcare, e-commerce, retail, consulting, logistics, and education. Organisations do not just need engineers who can build pipelines. They need people who can read data, identify trends, build dashboards, and communicate findings to leadership. That is exactly where non-technical analysts thrive.
This complete guide covers everything you need to know: whether a data analytics career without coding is truly possible, the tools and skills you need, which job roles are available, realistic salary expectations in India, and a step-by-step roadmap to become job-ready.
Can You Really Build a Data Analytics Career Without Coding?
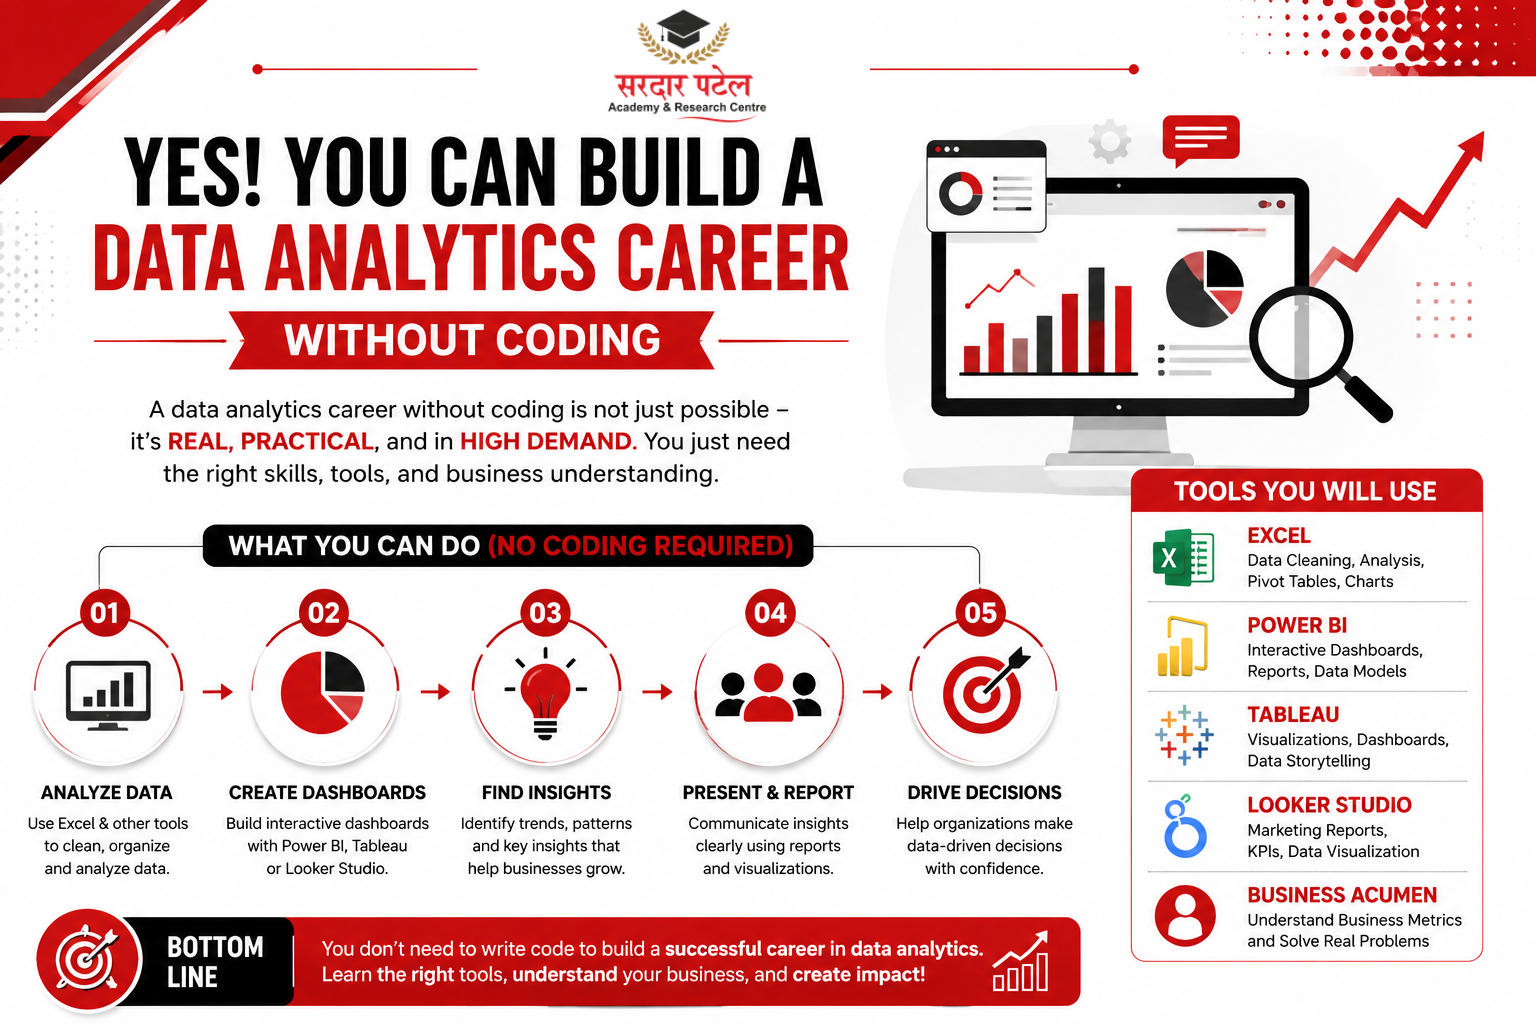
Yes — and this is not a conditional answer.
Many entry-level data analytics jobs do not list Python, R, or SQL as requirements. Employers hiring for business analyst, reporting analyst, MIS executive, and marketing analyst roles typically look for candidates who can:
- Analyse and clean data using Excel or Google Sheets
- Build interactive dashboards in Power BI or Tableau
- Understand business metrics such as revenue, profit margins, CAC, and churn
- Present insights clearly to stakeholders
- Solve business problems using data — not write code
A data analytics career without coding is not a workaround or a shortcut. It is a legitimate and widely practised career path. Many experienced analysts working at large companies — MNCs, consulting firms, banks, and tech startups — have never written a single line of Python.
Coding skills can certainly help you grow faster and access higher-paying roles over time. But they are not the starting point. If you're still confused, read our complete guide to "Is Data Analytics Hard for Beginners?" They are an optional upgrade once you have built your foundation.
Can Non-Technical Students Learn Data Analytics?
This is one of the most searched questions about analytics careers — and the answer is an unqualified yes.
Non-technical students from commerce, arts, humanities, management, and economics backgrounds are entering data analytics roles every day. Academic background is far less important than your ability to think analytically and communicate findings clearly.
Students with degrees in BCom, BBA, BA Economics, BA Statistics, MBA, or even fields like Psychology and History have successfully transitioned into data analytics careers. If you're from a commerce background, read our detailed guide on Can Commerce Students Learn Data Analytics?
What matters to employers is:
• Can you work with data tools like Excel and Power BI?
• Can you identify trends and patterns in business data?
• Can you explain your findings in plain language?
• Do you understand what the numbers mean for the business?
If the answer to these questions is yes, your academic background is secondary. Non-technical students who invest time in learning the right tools and building real projects consistently land analytics jobs. data analytics course eligibility and career opportunities
Why Companies Are Actively Hiring Non-Technical Data Analysts
Every business today generates enormous volumes of data — from sales transactions and website traffic to customer behaviour and marketing performance. The challenge is not collecting this data. The challenge is making sense of it.
Organisations need people who can answer business-critical questions such as:
- Which products are generating the highest margins?
- Why did customer retention drop last quarter
- Which marketing campaigns are delivering the best return on investment?
- How do we reduce operational costs without affecting output?
- What does the sales pipeline look like for the next 90 days?
Answering these questions does not require programming. It requires business judgment, analytical thinking, and the ability to visualise data effectively. A data analytics career without coding is not just possible — in many industries, it is exactly what hiring managers are looking for.
Companies often find that analysts with strong business understanding and communication skills create more value than technically skilled candidates who cannot translate their work into business language.
Essential Skills for a Data Analytics Career Without Coding
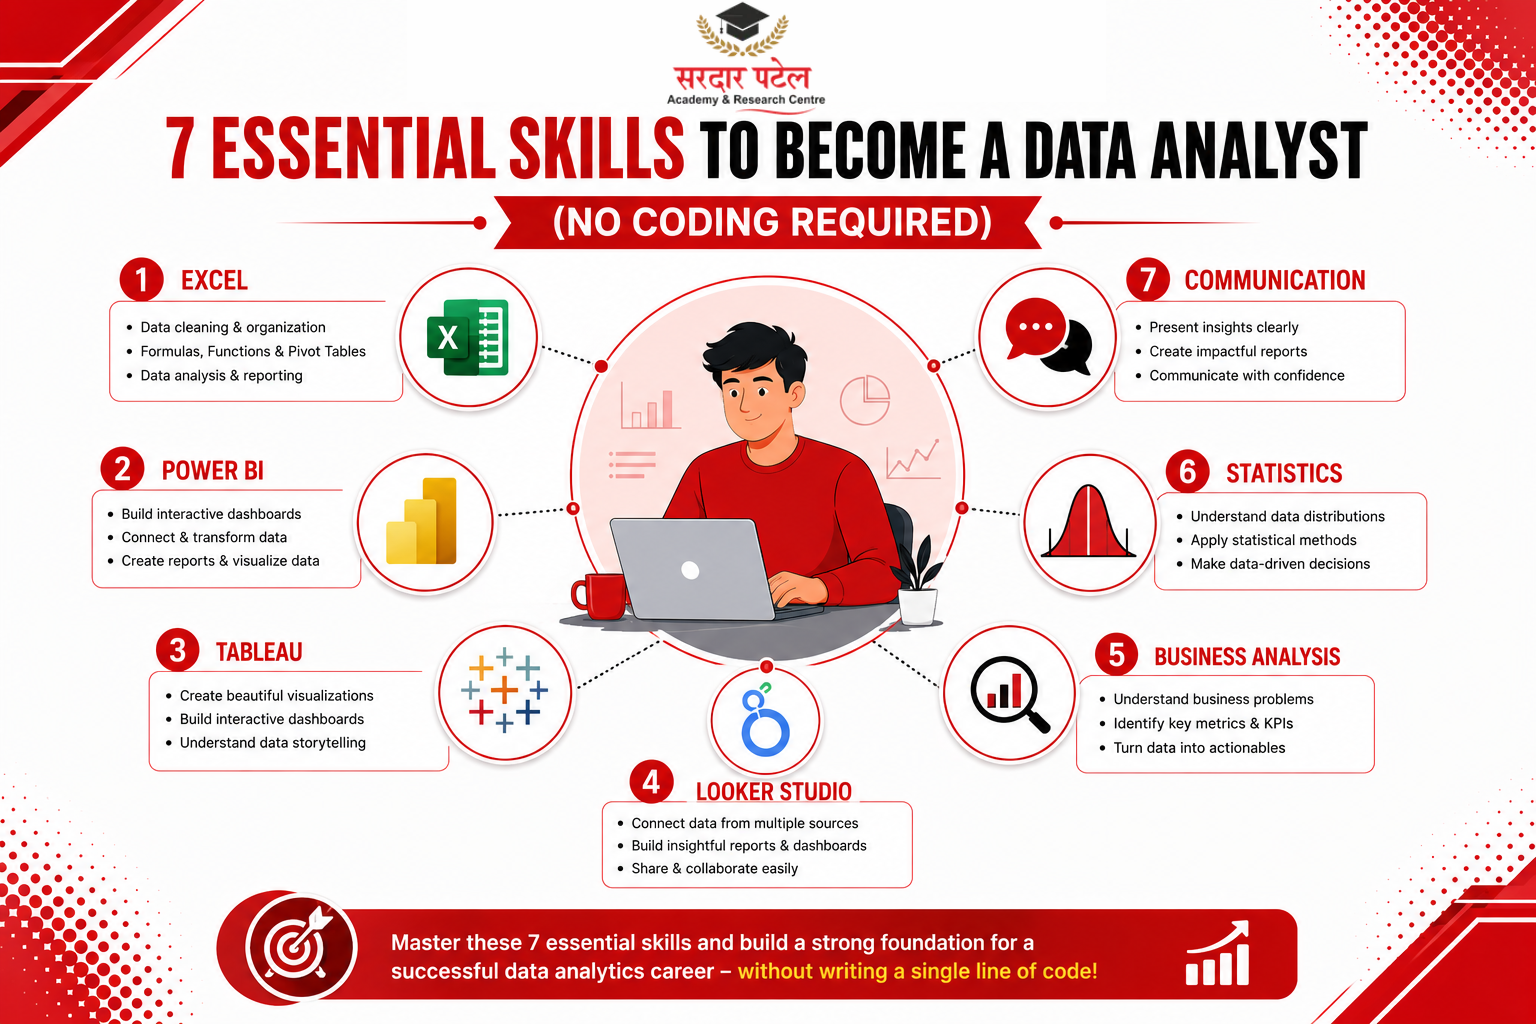
1. Microsoft Excel — The Foundation of Every Analytics Role
Excel is the single most important tool for anyone starting a data analytics career without coding. It is used in virtually every industry, every company size, and at every level of analytics work.
Key Excel skills to master:
• Pivot Tables and Pivot Charts for dynamic summaries
• VLOOKUP, XLOOKUP, and INDEX-MATCH for combining datasets
• IF, SUMIF, COUNTIF, and nested formulas for logic-based analysis
• Data cleaning — removing duplicates, fixing formats, handling blanks
• Conditional formatting to highlight trends and anomalies
• Dashboard building with slicers and linked charts
• Named ranges and dynamic arrays for advanced reporting
Excel remains the benchmark for data analytics jobs without programming, even as newer tools gain popularity.
2. Power BI — The Most In-Demand Dashboard Tool in India
Microsoft Power BI is currently the most in-demand business intelligence tool in India. Knowing Power BI significantly improves your chances of landing a data analytics job without coding knowledge.
Key Power BI skills:
• Connecting to data sources (Excel, SQL, SharePoint, Google Sheets)
• Data modelling using relationships between tables
• Creating calculated columns and measures using DAX (beginner level)
• Building interactive reports and dashboards
• Publishing reports to the Power BI Service for sharing
• Creating drill-through pages and cross-filtering visuals
Power BI is a low-code tool. You do not need to know SQL or Python to use it effectively at the entry level. Learning the basics takes 4–6 weeks of focused practice.
3. Tableau — Visual Storytelling for Business Data
Tableau is widely used in consulting, marketing analytics, and finance. It is particularly valued for its ability to create visually compelling dashboards that non-technical leadership can understand instantly.
Key Tableau skills:
• Connecting and blending multiple data sources
• Building bar charts, line charts, scatter plots, heat maps, and maps
• Creating calculated fields for custom metrics
• Designing executive dashboards with filters and parameters
• Publishing to Tableau Public for portfolio building
4. Google Looker Studio — Free Tool for Marketing and Digital Analytics
Google Looker Studio (formerly Data Studio) is free and integrates directly with Google Analytics, Google Ads, Search Console, and Google Sheets. It is ideal for digital marketing analysts and anyone working with web or campaign data.
5. Business Analysis and Domain Knowledge
This is where non-technical candidates often have a genuine advantage over engineering graduates. Understanding how businesses actually operate makes you a more valuable analyst.
Key business concepts to learn:
• Revenue, gross profit, net profit, and EBITDA
• Customer acquisition cost (CAC) and customer lifetime value (LTV)
• Churn rate, retention rate, and monthly active users (MAU)
• Sales pipeline metrics and conversion rates
• KPI frameworks and OKRs
• Financial statement basics — P&L, balance sheet reading
The more business context you bring to your data work, the more valuable your insights become.
6. Statistics Fundamentals — No Advanced Math Required
You do not need to be a mathematician to start a data analytics career without coding. But a basic understanding of statistics helps you interpret data correctly and avoid misleading conclusions.
Core statistical concepts:
• Mean, median, mode — and when to use each
• Percentage change and year-over-year growth
• Variance and standard deviation (basic interpretation)
• Correlation vs. causation
• Trend identification and seasonality
• Basic forecasting using moving averages
These concepts can be applied directly in Excel without any programming.
7. Communication and Data Storytelling
The most underrated skill in analytics is the ability to communicate findings clearly. Raw data means nothing if you cannot explain what it tells the business.
Strong communication skills help you:
• Present dashboards to leadership in a way that drives decisions
• Write clear, concise analytical reports
• Answer “so what?” questions about your data
• Build trust with non-technical stakeholders
• Influence strategy using data evidence
Many analytics professionals who advance quickly do so because of their communication ability, not their technical depth.
Best No-Code and Low-Code Analytics Tools for Beginners
| Tool |
Best For |
Cost |
| Microsoft Excel |
Reporting, data cleaning, dashboards |
Paid (usually available via MS Office) |
| Power BI Desktop |
Interactive BI dashboards, business reporting |
Free (Desktop version) |
| Microsoft Power BI Service |
Cloud sharing, collaboration, and scheduled refresh |
Free (basic) / Paid (Pro) |
| Tableau Public |
Visual storytelling, portfolio building |
Free |
| Google Looker Studio |
Marketing analytics, web data |
Free |
| Google Sheets |
Collaborative data work, quick analysis |
Free |
All of these tools can be learned without any programming background. Start with Excel, then Power BI.
| 🏫 Learn Data Analytics at SPARC — GTB Nagar, Delhi At Sardar Patel Academy & Research Centre (SPARC), our Data Analytics Course is specifically designed for non-technical learners, starting from Excel fundamentals and progressing to Power BI, Tableau, SQL, and Python with real-world projects. 📞 Contact SPARC today to know more about the next batch. |
Job Roles Available in Data Analytics Without Coding
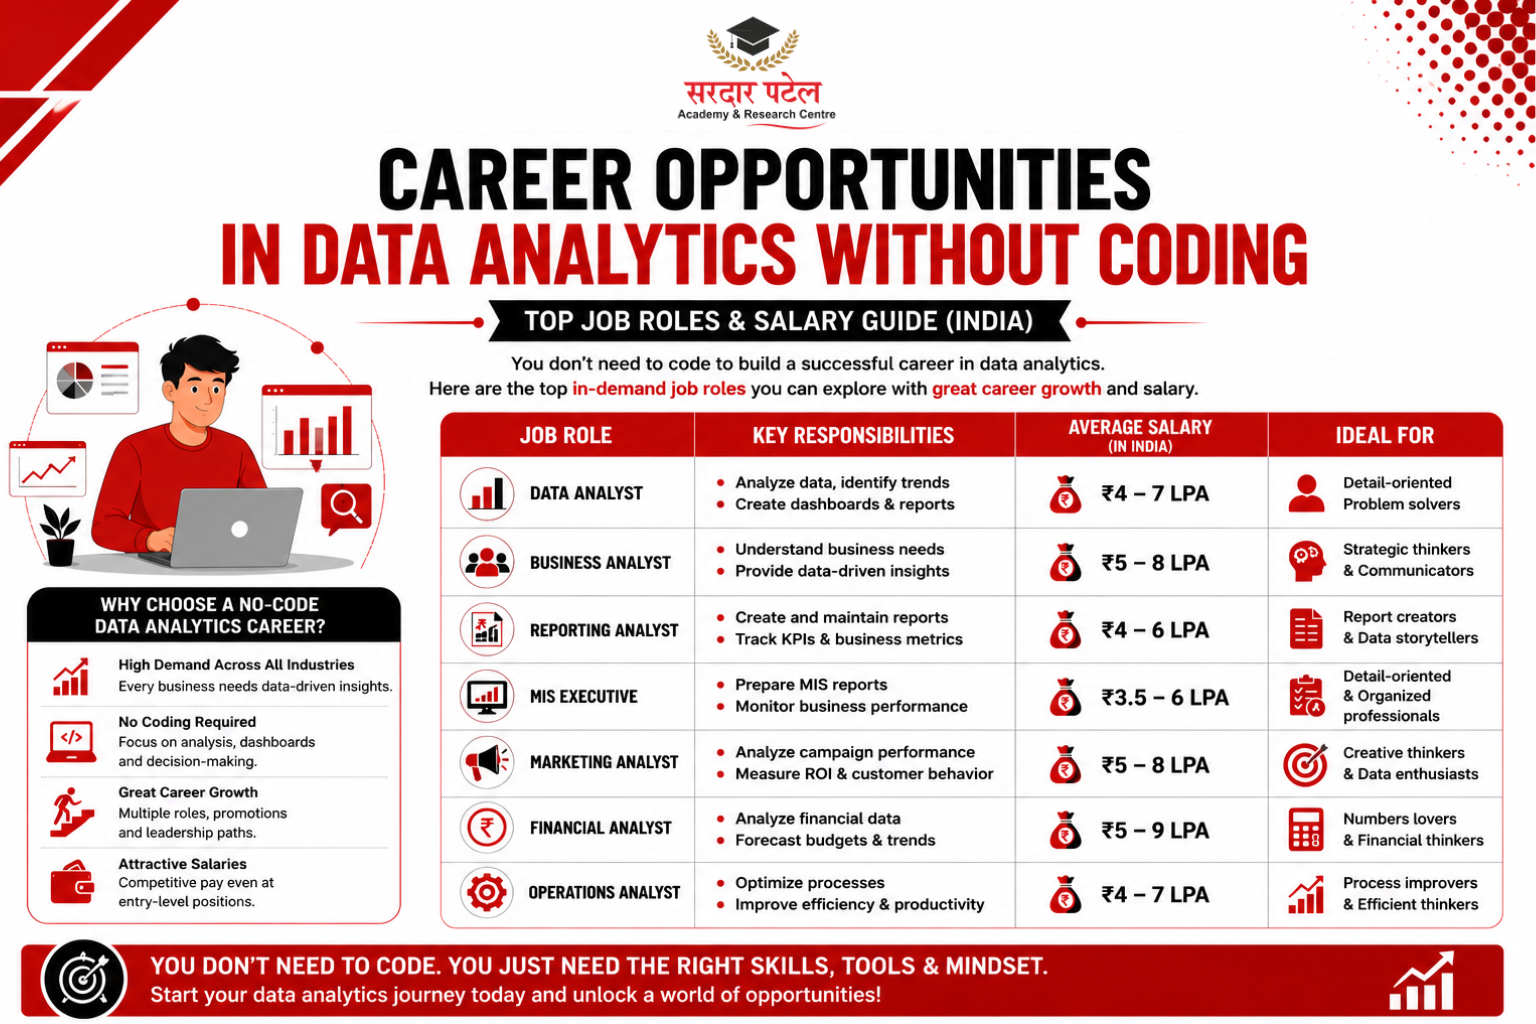
Data Analyst (Entry Level)
The most common job title for analytics professionals. Entry-level data analyst roles typically involve maintaining dashboards, cleaning data, generating weekly or monthly reports, and tracking KPIs.
Skills required: Excel, Power BI or Tableau, basic statistics, business understanding
Average salary for freshers: ₹4–7 LPA
Business Analyst
Business analysts work at the intersection of data and business operations. They gather requirements from stakeholders, analyse performance data, and recommend improvements.
Skills required: Business process understanding, Excel, requirement documentation, data reporting
Average salary for freshers: ₹5–8 LPA
Reporting Analyst / MIS Executive
These roles focus on building and maintaining regular business reports and dashboards. They are common in banking, insurance, e-commerce, and manufacturing.
Skills required: Excel (advanced), Power BI, data management, KPI tracking
Average salary: ₹3.5–6 LPA
Marketing Analyst
Marketing analysts track campaign performance, customer behaviour, and digital marketing metrics. Google Analytics, Looker Studio, and Excel are the primary tools.
Skills required: Google Analytics, Looker Studio, Excel, campaign metrics
Average salary for freshers: ₹5–8 LPA
Financial Analyst (Junior)
Financial analysts support budgeting, forecasting, and financial reporting through Excel and financial modelling.
Skills required: Excel (advanced), financial statement understanding, pivot tables, financial modelling basics
Average salary for freshers: ₹5–9 LPA
Operations Analyst
Operations analysts monitor supply chain, logistics, or production performance using dashboards and reports.
Skills required: Excel, Power BI, process understanding
Average salary: ₹4–7 LPA
Step-by-Step Roadmap: How to Start a Data Analytics Career Without Coding
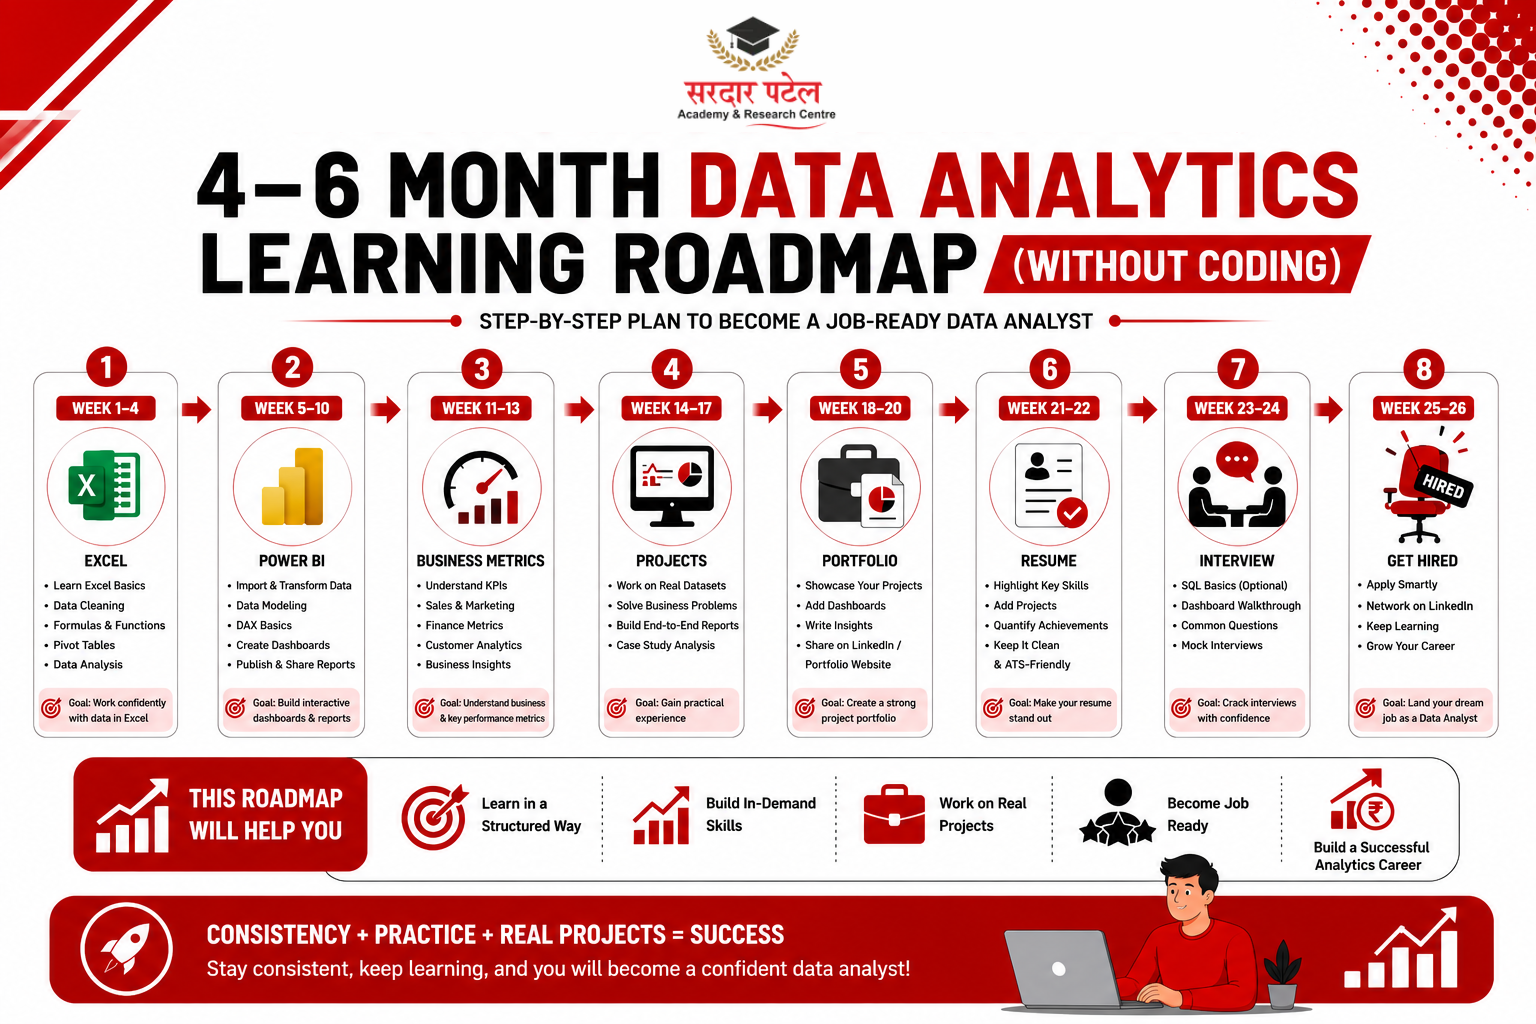
complete data analytics learning guide
Step 1: Build Your Excel Foundation (Weeks 1–4)
Start with Excel because it is used in every analytics role and every company. Focus on:
• Formulas (IF, VLOOKUP, SUMIF, COUNTIF, INDEX-MATCH)
• Pivot Tables and Pivot Charts
• Data cleaning techniques
• Building basic dashboards with slicers
Practice daily using free datasets from Kaggle or government data portals.
If you're completely new to this field and wondering whether learning analytics is difficult, check out our guide on Is Data Analytics Hard for Beginners?
Step 2: Learn Power BI (Weeks 5–10)
Power BI is the most in-demand analytics tool in India in 2026. Download the free Power BI Desktop and follow structured tutorials on:
• Importing and transforming data
• Creating relationships between tables
• Building dashboards with multiple visuals
• Using basic DAX measures (SUM, CALCULATE, DIVIDE)
Build at least two complete dashboards during this phase — one for sales data and one for financial data.
Step 3: Learn Business Metrics and Domain Knowledge (Weeks 11–13)
Study the business metrics used in one or two industries you want to work in. If you are targeting e-commerce, learn about cart abandonment, AOV, and CLV. If you are targeting banking, learn about NPA ratios and loan performance metrics.
This domain knowledge makes you immediately useful in interviews.
Step 4: Build Real Projects (Ongoing from Week 8)
Projects are the single most important part of your job search preparation. Build:
- A Sales Performance Dashboard in Power BI
- A Financial Profitability Report in Excel
- A Marketing Campaign Analysis in Looker Studio
- A Customer Segmentation Study using Excel Pivot Tables
- An Operations KPI Tracker in Power BI
Document your thought process for each project — what question you were answering, what data you used, and what business insights you found.
Step 5: Create a Portfolio (Week 14–16)
Upload your dashboards to Tableau Public, Power BI Community, or GitHub. Create a PDF or presentation explaining each project. A strong portfolio of 3–5 real projects often matters more than any certification.
Step 6: Apply for Jobs and Internships
Target job titles: Data Analyst, Business Analyst, MIS Executive, Reporting Analyst, Junior Analyst. Apply on LinkedIn, Naukri, Internshala, and company career pages. Prepare for common interview questions around your projects, Excel formulas, and basic business concepts.
Salary Expectations for Data Analytics Without Coding
| Experience Level |
Average Salary (India) |
| Fresher (0–1 year) |
₹3.5 – 6 LPA |
| Junior Analyst (1–3 years) |
₹6 – 10 LPA |
| Mid-Level Analyst (3–5 years) |
₹10 – 15 LPA |
| Senior Analyst / Lead (5+ years) |
₹15 – 25 LPA |
Source: Naukri.com / AmbitionBox, Q1 2026. Figures vary by city, industry, and company size.
data analytics career scope, skills, and salaries
Salaries vary significantly by city (Mumbai, Bengaluru, and Delhi NCR pay more), industry (tech and consulting pay more than manufacturing), and company type (MNCs pay more than small businesses).
Professionals who add SQL or Python to their no-code foundation after 1–2 years often see 30–50% salary jumps, but this is optional, not required, to start.
Common Myths About Data Analytics Careers — Debunked
Myth 1: “You must know coding to become a data analyst.”
This is the most damaging myth in the analytics space. Thousands of practising data analysts in India work entirely with Excel and Power BI. Coding is optional at the entry level.
Myth 2: “Only engineering graduates get analytics jobs.”
False. Commerce, arts, economics, management, and finance graduates regularly get hired into analytics roles. Employers care about skills and projects, not your degree stream.
Myth 3: “Certifications guarantee you a job.”
A Power BI or Google Data Analytics certificate does not substitute for a strong portfolio of real projects. Certifications can support your resume, but they do not replace demonstrated skills.
Myth 4: “Analytics is all about math and numbers.”
Data analytics also involves business communication, visual design, storytelling, stakeholder management, and critical thinking. It is as much a business role as a technical one.
Myth 5: “You need to know SQL to get any analytics job.”
Many entry-level analytics jobs — particularly MIS, reporting, and business analyst roles — do not require SQL. Excel and Power BI handle the data access and transformation at this level.
Future Scope of Data Analytics in 2026 and Beyond
The long-term outlook for data analytics professionals is strong. Organisations across every industry continue to invest heavily in:
• Business Intelligence and self-service analytics
• Data visualisation and executive dashboards
• Customer analytics and personalisation
• Financial and operational performance management
• AI-assisted analytics tools (which make no-code analytics even more powerful)
As AI tools become embedded into platforms like Excel and Power BI (Microsoft Copilot, for example), non-technical analysts can do more sophisticated work without learning to code. This trend is expanding career opportunities for people building a data analytics career without coding — not reducing them.
| 🏫 Ready to Start? Join SPARC — Sardar Patel Academy & Research Centre, GTB Nagar, Delhi At SPARC, our data analytics program is built for non-technical learners. Whether you are from commerce, arts, or any humanities background, we take you from Excel basics to Power BI dashboards and Python fundamentals — step by step, with real project work and placement support. Many of our students have secured analytics roles within months of completing the program. Your career in data analytics can start today. 📞 Contact SPARC at GTB Nagar, Delhi, to learn about upcoming batches and enrol now. |
Conclusion: Your Data Analytics Career Without Coding Starts Today
A data analytics career without coding is not just possible in 2026 — it is a well-established career path followed by thousands of successful professionals across India and globally.
The path is clear: start with Excel, build your skills in Power BI, understand business metrics, create real projects, and develop your ability to communicate insights clearly. These four pillars will make you a competitive candidate for entry-level analytics roles within 4–6 months.
If you have been wondering whether non-technical students can learn analytics and build a real career from it — the answer is yes, with one condition: you have to put in the practice. Tools can be learned. Projects can be built. Skills develop through repetition.
The analytics job market does not care whether you studied commerce or computer science. It cares whether you can take a messy dataset, make sense of it, and present a clear recommendation to a business team. That is a skill anyone can develop — with or without coding knowledge.
Ready to start your data analytics career without coding? Visit SPARC to explore our training programs, upcoming batches, and placement support.
FAQs
Yes. Many entry-level and mid-level data analyst roles require only Excel, Power BI, business analysis skills, and strong communication. Coding is not a requirement for most analytics job descriptions in India.
Absolutely. Students from commerce, arts, management, economics, and other non-technical backgrounds regularly transition into data analytics careers. What matters is your ability to learn the tools and apply them to real business problems.
Start with Microsoft Excel. It is the most universally used analytics tool and the foundation for Power BI, which should be your second tool.
No. Python is valuable for advanced analytics, machine learning, and automation, but it is not required to start or sustain a successful analytics career. Many mid-level analysts never use it.
Not for most entry-level roles. Excel, Power BI, and Tableau can handle data extraction and transformation at the level required for most fresher and junior analyst positions.
Most learners can become job-ready in 4–6 months with structured learning, daily practice, and a portfolio of 3–5 real projects.
Freshers typically earn between ₹3.5 LPA and ₹6 LPA, depending on skills, city, industry, and company size.
Yes. Data analytics continues to be one of the highest-demand, fastest-growing career fields globally. The rise of AI tools is expanding the role of analysts, not replacing them, particularly those who combine business understanding with data skills.
No specific degree is required. Analytics employers hire from BCom, BBA, MBA, BA, BSc, and engineering backgrounds equally, provided you can demonstrate practical skills.
Banks, insurance companies, e-commerce platforms, FMCG companies, consulting firms, healthcare organizations, logistics companies, and marketing agencies all actively hire non-technical data analysts.