+91 9312966129
 sparc.enquiry01@gmail.com


Skills Required to Become Data Analyst
Discover the exact technical and business skills required for data analytics jobs in 2026 — tools, learning roadmap, and tips to get hired faster.

Table of Contents
- What Does a Data Analyst Actually Do?
- Technical Skills Required for Data Analytics Jobs
- 1. Microsoft Excel — The Foundation
- 2. SQL — The Most In-Demand Technical Skill
- 3. Power BI — The Dashboard Standard
- 4. Python — The Skill That Opens Advanced Doors
- 5. Statistics — The Thinking Behind the Numbers
- 6. Data Visualisation — Making Insights Accessible
- Business and Soft Skills That Get You Hired
- Communication Skills
- Critical Thinking
- Attention to Detail
- Business Acumen
- Stakeholder Management
- Skills by Job Role — What to Focus On
- Learning Roadmap — From Zero to Job-Ready
- Month 1 — Build the Foundation
- Month 2 — Add Visualisation and Analysis
- Month 3 — Python and Real Projects
- Common Skill Gaps That Cost Candidates the Job
- How to Showcase Skills to Employers
- Build a GitHub Portfolio:
- Create a LinkedIn Skills Section:
- Certify What You Know:
- Master Industry Skills at SPARC
- Ready to Build Every Skill on This List?
Most people preparing for a data analyst role make the same mistake — they focus entirely on tools and ignore the skills that actually get them hired.
Knowing Power BI or SQL is a starting point, not a finish line. Employers in 2026 are looking for candidates who can think through a business problem, find relevant data, analyze it correctly, and communicate their findings in a way that drives real decisions.
This guide breaks down every skill required for data analytics jobs — technical and non-technical — along with a practical learning sequence designed to take you from beginner to interview-ready as efficiently as possible.
Once you have your skills in place, the next step is choosing the right program — read our guide on the Best Data Analytics Course in Delhi with Placement to compare options.
What Does a Data Analyst Actually Do?
Before mapping out which skills to build, it helps to understand what the job actually involves on a day-to-day basis.
A data analyst's core responsibility is converting raw, unstructured data into clear, actionable insights that help a business make better decisions. In practice, this means:
- Pulling data from databases using SQL queries
- Cleaning and organising messy datasets in Excel or Python
- Building dashboards that track key business metrics
- identifying trends, anomalies, and patterns in historical data
- presenting findings to managers, stakeholders, or product teams
The tools change depending on the company and industry, but this core workflow remains consistent across most analytics roles. Every skill listed in this guide connects directly to one or more steps in this process.
Technical Skills Required for Data Analytics Jobs
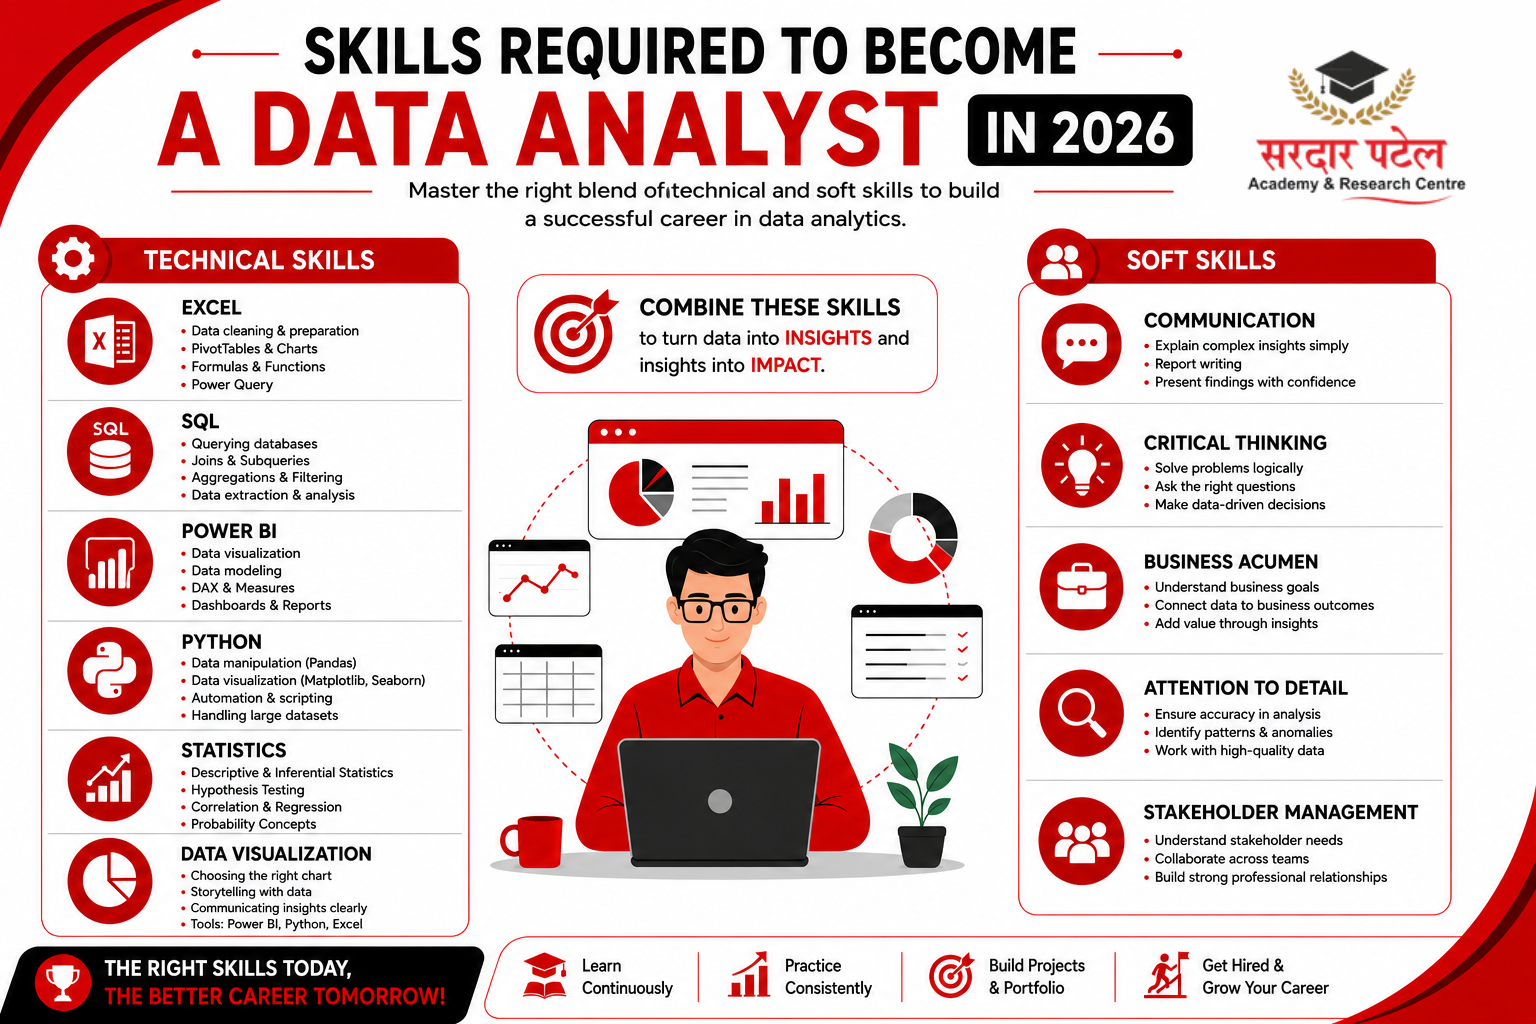
1. Microsoft Excel — The Foundation
Despite the rise of advanced tools, Excel remains one of the most universally used applications in business analytics. It is typically the first tool assessed during hiring, especially for fresher and mid-level roles.
What you need to know:
- VLOOKUP, HLOOKUP, INDEX-MATCH for data retrieval
- PivotTables and PivotCharts for summarising large datasets
- Conditional formatting and data validation
- IF, SUMIF, COUNTIF, and nested formula logic
- Power Query for importing and transforming external data
Why it matters: Many companies use Excel for daily reporting, budgeting, and operations tracking. Even roles that primarily use SQL or Power BI often require Excel for ad hoc analysis and presentations.
2. SQL — The Most In-Demand Technical Skill
If there is one skill that appears in nearly every data analyst job description across industries, it is SQL. Structured Query Language is how analysts extract, filter, and organise data from relational databases.
What you need to know:
- SELECT, WHERE, GROUP BY, ORDER BY — core query logic.
- JOINs(INNER, LEFT, RIGHT, FULL) — combining multiple tables
- Subqueries and Common Table Expressions (CTEs)
- Aggregate functions — SUM, COUNT, AVG, MAX, MIN
- Window functions — ROW_NUMBER, RANK, LEAD, LAG
Why it matters: Most organizations store their business data in relational databases (MySQL, PostgreSQL, SQL Server, BigQuery). Without SQL, you cannot access the data you need to analyze.
SQL is also one of the top skills assessed during interviews — see our guide on SQL Interview Questions for Freshers for the exact questions that get asked.
3. Power BI — The Dashboard Standard
Power BI has become the dominant business intelligence tool in Indian companies, particularly in banking, retail, and IT. It allows analysts to connect data sources, build interactive dashboards, and share visual reports with stakeholders.
What you need to know:
- Connecting data sources — Excel, SQL databases, web APIs
- Data modelling — relationships between tables, star schema basics
- DAX (Data Analysis Expressions) — calculated columns and measures
- Creating and formatting interactive visuals
- Publishing reports and setting up scheduled refreshes
Why it matters: Dashboard development is a core deliverable in most analytics roles. Companies need analysts who can not only find insights but also present them in a format that non-technical stakeholders can act on quickly.
4. Python — The Skill That Opens Advanced Doors
Python is not always required at the entry level, but it dramatically expands what you can do as an analyst and significantly improves your long-term career trajectory.
What you need to know for analytics:
- Pandas — data manipulation, filtering, grouping, merging datasets
- NumPy — numerical operations and array handling
- Matplotlib and Seaborn — data visualisation and chart creation
- Basic statistics with SciPy — hypothesis testing, correlation
- Jupyter Notebooks — for structured, shareable analysis
Why it matters: Python allows you to handle datasets too large for Excel, automate repetitive tasks, and perform statistical analysis that goes beyond what SQL or Power BI can do. It is also the gateway into machine learning and data science if you want to advance further.
5. Statistics — The Thinking Behind the Numbers
Many candidates skip statistics because it feels theoretical. This is one of the most common reasons technically skilled candidates fail analytics interviews and struggle in real job situations.
What you need to understand:
- Descriptive statistics — mean, median, mode, standard deviation
- Probability basics — how to interpret likelihood and distributions
- Hypothesis testing — null hypothesis, p-value, significance level
- Correlation vs. causation — a critical distinction in business analysis
- Regression basics — understanding relationships between variables
- Data distributions — normal, skewed, and how they affect analysis
Why it matters: Statistics is the framework that determines whether your analysis is trustworthy. Without it, you can find patterns in data that do not actually mean anything — and make bad business recommendations as a result.
6. Data Visualisation — Making Insights Accessible
Producing an accurate analysis is only half the job. The other half is presenting it in a way that the right people can understand and act on quickly.
What you need to know
- Choosing the right chart type for the right data (bar, line, scatter, heatmap, funnel)
- Design principles — colour hierarchy, whitespace, labelling clarity
- Storytelling with data — structuring a narrative around findings
- Building executive-level dashboards that prioritise key metrics
- Avoiding common visualisation mistakes — misleading axes, chart junk, overloaded visuals
Why it matters: A brilliant analysis that nobody understands has no business impact. Visualisation is what bridges data and decision-making.
Business and Soft Skills That Get You Hired
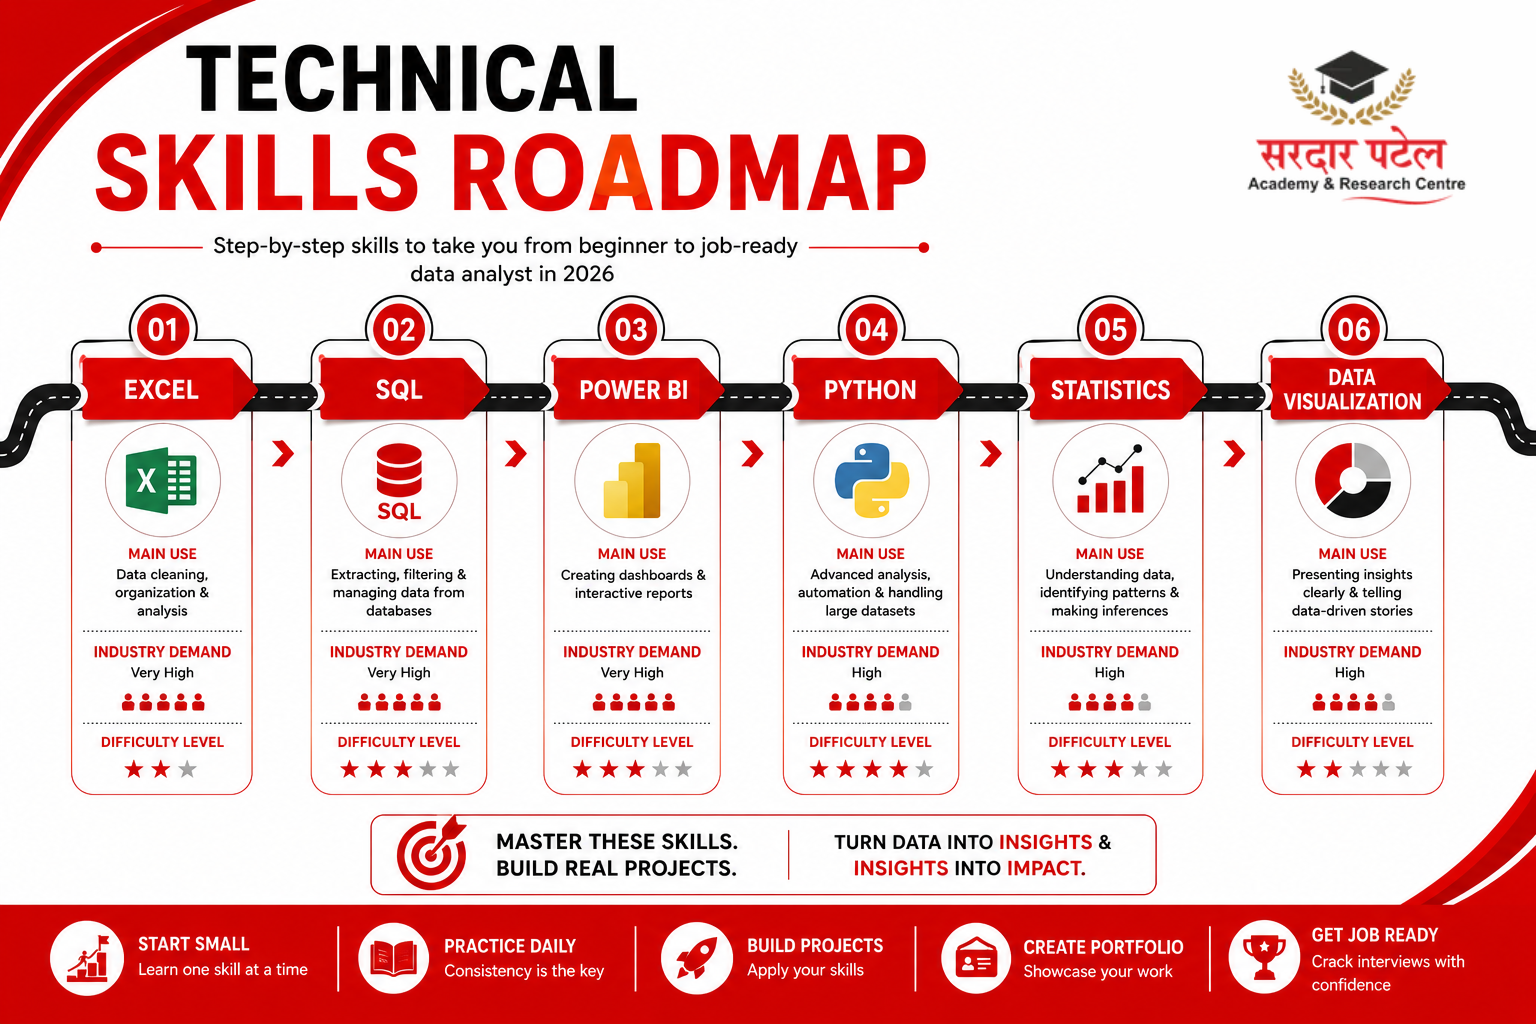
Technical skills determine whether you can do the job. Soft skills determine whether you get the offer — and whether you grow once you are in the role.
Communication Skills
Analysts regularly present findings to managers, finance teams, and product leads who have no data background. Your ability to translate complex analysis into clear, simple language directly affects how useful your work is perceived to be.
Critical Thinking
Before touching any dataset, strong analysts ask: "What is the actual business question we are trying to answer?" Jumping straight into analysis without defining the problem leads to wasted effort and irrelevant outputs.
Attention to Detail
A single formula error or a miscalculated metric in a dashboard can mislead an entire department's strategy. Data quality and accuracy are non-negotiable.
Business Acumen
Understanding how your company makes money, who its customers are, and what its key performance metrics are makes your analysis far more relevant and actionable. Analysts who connect data to business outcomes get noticed faster.
Stakeholder Management
You will often work with people who do not understand data — and who have strong opinions about what the data should say. Managing expectations, explaining limitations, and staying objective under pressure are skills that separate average analysts from excellent ones.
Skills by Job Role — What to Focus On
Not every analytics role requires the same skill depth. Here is a focused breakdown:
| Role |
Must-Have Skills |
Good to Have |
| Data Analyst |
Excel, SQL, Power BI, Statistics |
Python, Tableau |
| Business Analyst |
Excel, SQL, Communication, Documentation |
Power BI, Process mapping |
| BI Analyst |
Power BI, SQL, DAX, Data Modelling |
Python, ETL basics |
| Marketing Analyst |
Excel, SQL, Google Analytics |
Python, A/B testing |
| Financial Analyst |
Excel, Statistics, Financial modelling |
SQL, Power BI |
| Product Analyst |
SQL, Python, A/B Testing, Statistics |
Power BI, Mixpanel |
Use this table to prioritise your learning based on the specific role you are targeting rather than trying to learn everything at once.
Wondering which role fits your background? Read our detailed breakdown on Is Coding Required for Data Analytics? to see what employers are actually prioritising right now.
Learning Roadmap — From Zero to Job-Ready
Before following this roadmap, it's helpful to understand the complete learning journey. Read our Data Analytics Learning Guide to explore the skills, tools, and study plan required to become a job-ready data analyst.
Month 1 — Build the Foundation
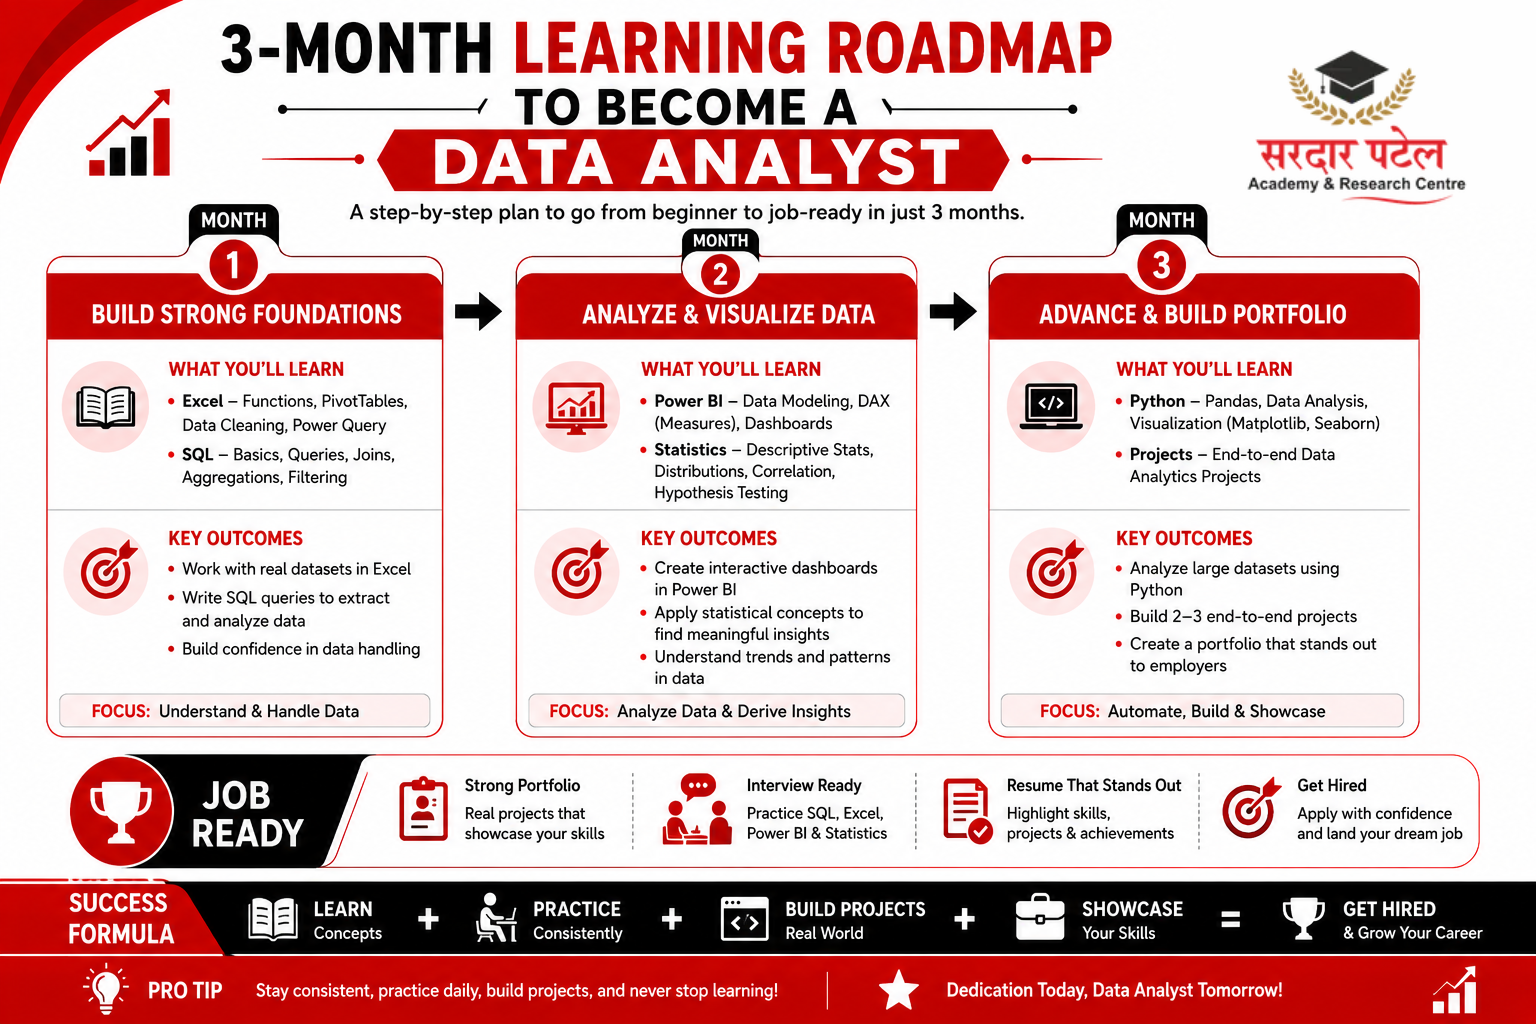
- Week 1–2: Excel fundamentals — formulas, PivotTables, basic charts
- Week 3–4: SQL basics — SELECT queries, filtering, JOINs
Goal by the end of Month 1: Extract and summarise data independently using Excel and SQL.
Month 2 — Add Visualisation and Analysis
- Week 1–2: Power BI — connect data, build dashboards, learn DAX basics
- Week 3–4: Statistics fundamentals — descriptive stats, distributions, hypothesis testing basics
Goal by the end of Month 2: Build a complete business dashboard from a raw dataset.
Month 3 — Python and Real Projects
- Week 1–2: Python with Pandas and NumPy — data cleaning and manipulation
- Week 3–4: Matplotlib/Seaborn — visualisation in Python + work on a complete end-to-end project
Goal by the end of Month 3: Complete 2–3 real-world projects that demonstrate your full workflow.
Building projects is one of the fastest ways to get noticed by recruiters — read our guide on Parents' Feedback About Data Analytics Training, with step-by-step instructions.
Common Skill Gaps That Cost Candidates the Job
Based on what recruiters consistently report, these are the areas where most candidates fall short:
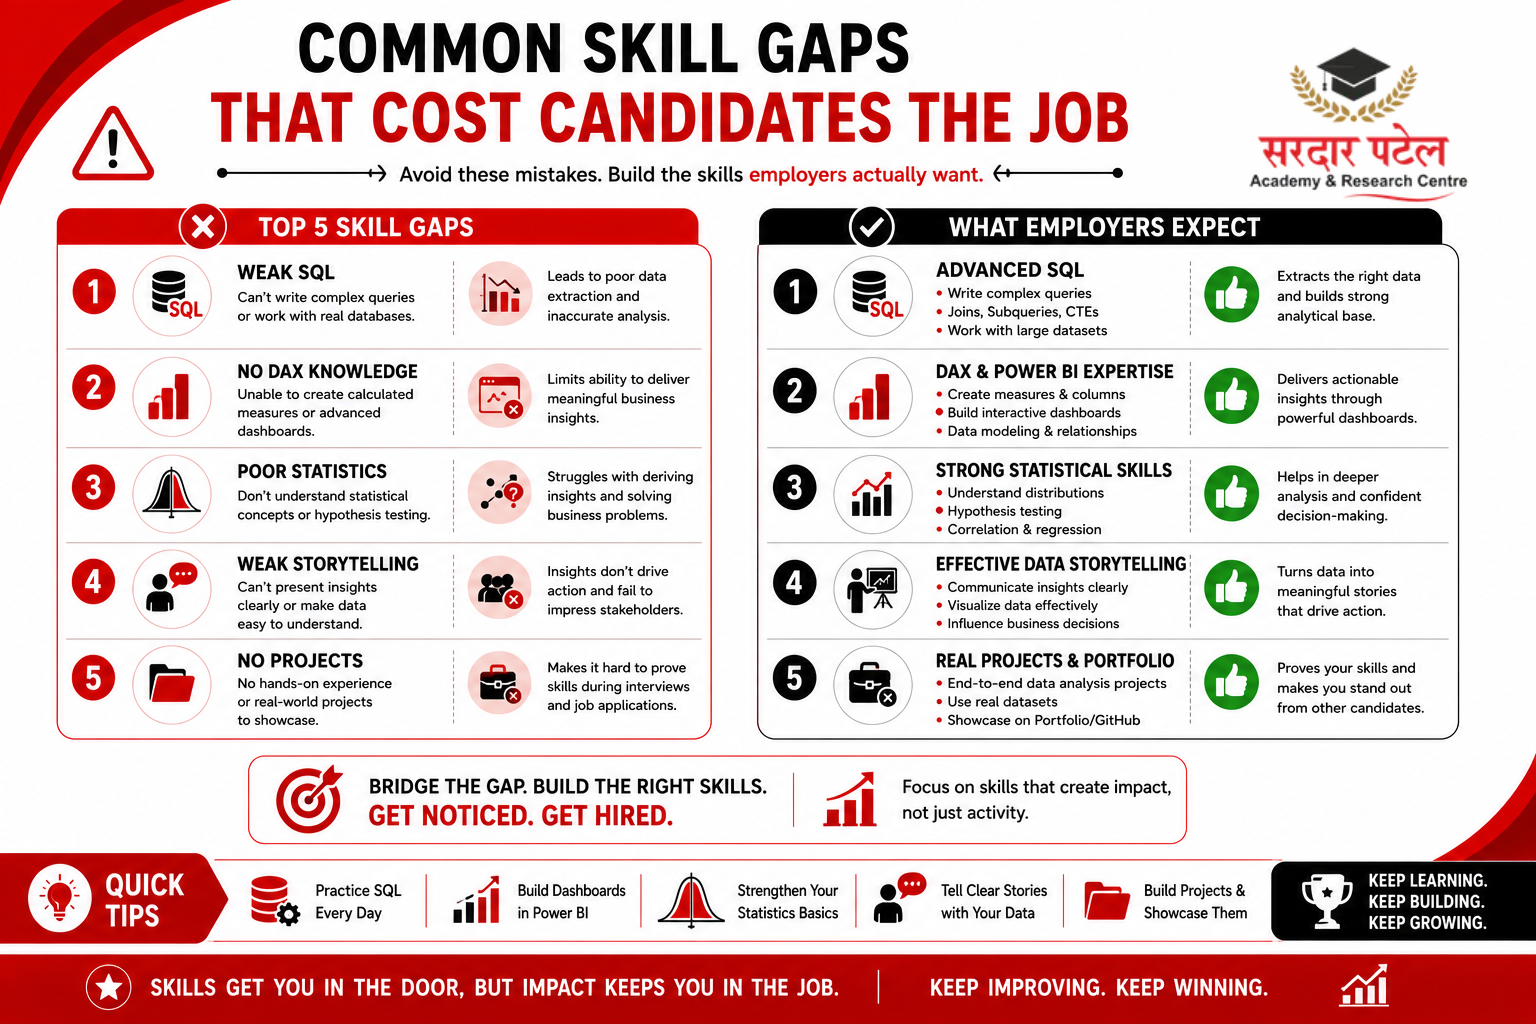
1. SQL beyond basic queries. Most candidates can write a SELECT statement. Far fewer can confidently write JOINs across three tables, use window functions, or optimize a slow query. This is where hiring decisions often get made.
2. DAX in Power BI: Candidates learn to drag and drop visuals but cannot write calculated measures or build a proper data model. This limits the complexity of dashboards they can build.
3. Statistical interpretation: Knowing how to run a formula is not enough. Interviewers ask: "What does this p-value tell you?" or "Why is the mean misleading here?" Candidates who cannot answer these questions struggle in technical rounds.
4. Data storytelling: Showing a chart is not presenting an insight. Explaining what the chart means, why it matters, and what action it suggests — that is storytelling. Most candidates do not practice this.
5. End-to-end project experience: Working with toy datasets in isolation does not prepare you for real work. Employers want to see that you can take a messy, real-world dataset and produce a complete, well-documented analysis.
How to Showcase Skills to Employers
Building skills is step one. Making them visible to employers is step two.
Build a GitHub Portfolio:
Upload your SQL scripts, Python notebooks, and Power BI screenshots with clear documentation. Recruiters actively check GitHub for analyst candidates.
Create a LinkedIn Skills Section:
List your tools and request endorsements from classmates, instructors, or colleagues. A profile with endorsements for SQL and Power BI ranks higher in recruiter searches.
Certify What You Know:
Relevant certifications add credibility to your resume:
- Microsoft PL-300 (Power BI Data Analyst Associate)
- Google Data Analytics Professional Certificate
- HackerRank SQL Certification (free, widely recognised)
Document Your Projects: For every project, write a summary that explains: the business problem, the data you used, the analysis you performed, and the insight you found. This becomes the foundation of your interview answers.
Master Industry Skills at SPARC
Ready to Build Every Skill on This List?
At Sardar Patel Academy & Research Centre (SPARC), the Data Analytics Program is built around exactly the skills employers are hiring for right now.
- Excel | SQL | Power BI | Python | Statistics
- Real industry projects — not just practice exercises
- Internship support for hands-on experience
- Placement assistance with resume building and mock interviews
Call Now: [ +91 93129-66129]
Email: [admissions@sparc.org.in ]
Enquire Now — [https://sparc.org.in]
New batch starting soon. Limited seats available.
Last updated: June 2026 | Content verified against current job market requirements in Delhi NCR
FAQs
SQL consistently ranks as the most in-demand technical skill across data analyst job descriptions in India. Combine it with Excel and Power BI, and you cover the requirements for most entry-level roles.
Not necessarily at the fresher level, but Python significantly expands your opportunities and is worth learning within the first 6 months of your career. It is essential for advanced analytics and data science roles.
A structured program covering Excel, SQL, Power BI, Python, and Statistics takes approximately 3–4 months. Add an internship component, and you are looking at 5–6 months to become fully job-ready.
Yes. Statistics is what makes your analysis reliable and defensible. Even for entry-level roles, basic knowledge of mean, median, distributions, and hypothesis testing is regularly tested in interviews.
Platforms like HackerRank, LeetCode (SQL section), and Mode Analytics offer free SQL exercises ranging from beginner to advanced. Consistent daily practice for 30–45 minutes over 4–6 weeks builds strong query-writing skills.
Absolutely. Students from commerce, arts, and management backgrounds regularly transition into analytics roles. The skills listed in this guide are learnable regardless of your academic background, provided you commit to structured, hands-on practice.
Focus on end-to-end projects that solve a real business question — for example, a sales performance dashboard in Power BI, a customer churn analysis in Python, or an SQL-based inventory report. Avoid toy datasets with no business context.
Test yourself: Can you write a SQL query with two JOINs and a GROUP BY without looking it up? Can you build a Power BI dashboard from scratch in under two hours? Can you explain what a p-value means in plain English? If yes to all three, you are ready to interview.