+91 9312966129
 sparc.enquiry01@gmail.com


Google Analytics Tutorial: Complete GA4 Guide 2026
A complete Google Analytics tutorial for beginners — GA4 setup, dashboard, metrics, reports, and conversions explained step by step.

Table of Contents
- What is Google Analytics?
- What is Google Analytics 4 (GA4)?
- Why Every Student Should Learn GA4
- How Google Analytics Works
- How to Create a GA4 Account
- Create Property
- Add Data Stream
- Install Tracking Code
- Verify Installation:
- Quick Checklist:
- Understanding the GA4 Dashboard
- Home
- Reports
- Explore
- Advertising
- Admin
- Important GA4 Metrics Every Beginner Should Know
- Users
- Sessions
- Engaged Sessions
- Engagement Rate
- Events
- Conversions
- Traffic Acquisition
- Landing Pages
- How to Read Google Analytics Reports
- How GA4 Helps SEO
- Common Beginner Mistakes
- Best Google Analytics Integrations
If you've opened Google Analytics once and closed the tab in confusion, you're not the only one. Every marketer, blogger, and business owner goes through that same moment before things click.
This Google Analytics tutorial is built for that exact stage — no prior experience needed. By the end, you'll understand what GA4 actually measures, how to set it up correctly, and how to read your own website's data with confidence.
Google Analytics is Google's free website tracking tool, and GA4 is its current version. It measures who visits your site, what they do, and which actions turn into results. This Google Analytics tutorial covers setup, dashboard navigation, key metrics, and reporting — everything a beginner needs to start reading real data.
What is Google Analytics?
Google Analytics is a free tool from Google that tracks how people find and use your website. It records visits, page views, clicks, and user behaviour, then turns that raw activity into reports you can actually act on.
Think of it as a security camera for your website — except instead of just recording, it tells you which pages people love, where they leave, and what convinced them to stay. Google Analytics has been the industry-standard tracking tool for over a decade, and understanding it is now a baseline skill across SEO, PPC, and content roles.
Did You Know?
Google Analytics is one of the most popular platforms for monitoring website performance and understanding visitor behaviour worldwide. GA4 is now the only actively supported version.
What is Google Analytics 4 (GA4)?
GA4 is the current version of Google Analytics, built around events instead of sessions, and designed to track users across websites and apps in one property. It replaced Universal Analytics, which officially stopped processing data on July 1, 2023.
Every Google Analytics tutorial today teaches GA4, because it's the only version Google actively supports. Unlike the old system, GA4 treats almost everything — a click, a scroll, a video play — as an "event," which gives far more flexible tracking once you understand the logic.
Expert Tip: Don't try to memorise every GA4 feature at once. Learn the dashboard, then events, then reports — in that order. Trying to learn all three simultaneously is the most common reason beginners give up early.
Why Every Student Should Learn GA4
Learning GA4 basics for students isn't optional anymore — nearly every digital marketing, SEO, or content role now expects at least beginner-level analytics reading skills. A basic understanding of GA4 reports can help students demonstrate practical analytics skills when applying for entry-level digital marketing roles.
A few real reasons this matters for students specifically:
- It's free and instantly practical. You can start tracking a real or practice website today, no budget needed.
- It connects directly to SEO and ads work. You can't prove content or campaign results without reading analytics.
- It's a resume differentiator. Students who can show real GA4 dashboard experience — not just theory — stand out immediately in interviews.
Beyond GA4, students can strengthen their career readiness by building practical digital marketing skills that complement their understanding of analytics and help them work more effectively with real-world marketing data.
How Google Analytics Works
Google Analytics works by placing a small tracking code on your website that sends visitor activity — page views, clicks, scrolls — back to Google's servers as events. GA4 then processes these events and organises them into reports you can explore inside the dashboard.
Here's the simplified flow:
- Visitor lands on your website.
- Tracking code (gtag.js or Google Tag Manager) fires and logs the visit as an event.
- Data travels to your GA4 property.GA4 processes and stores it, usually visible in reports within 24–48 hours.
- You read reports and make decisions based on real behaviour, not guesswork.
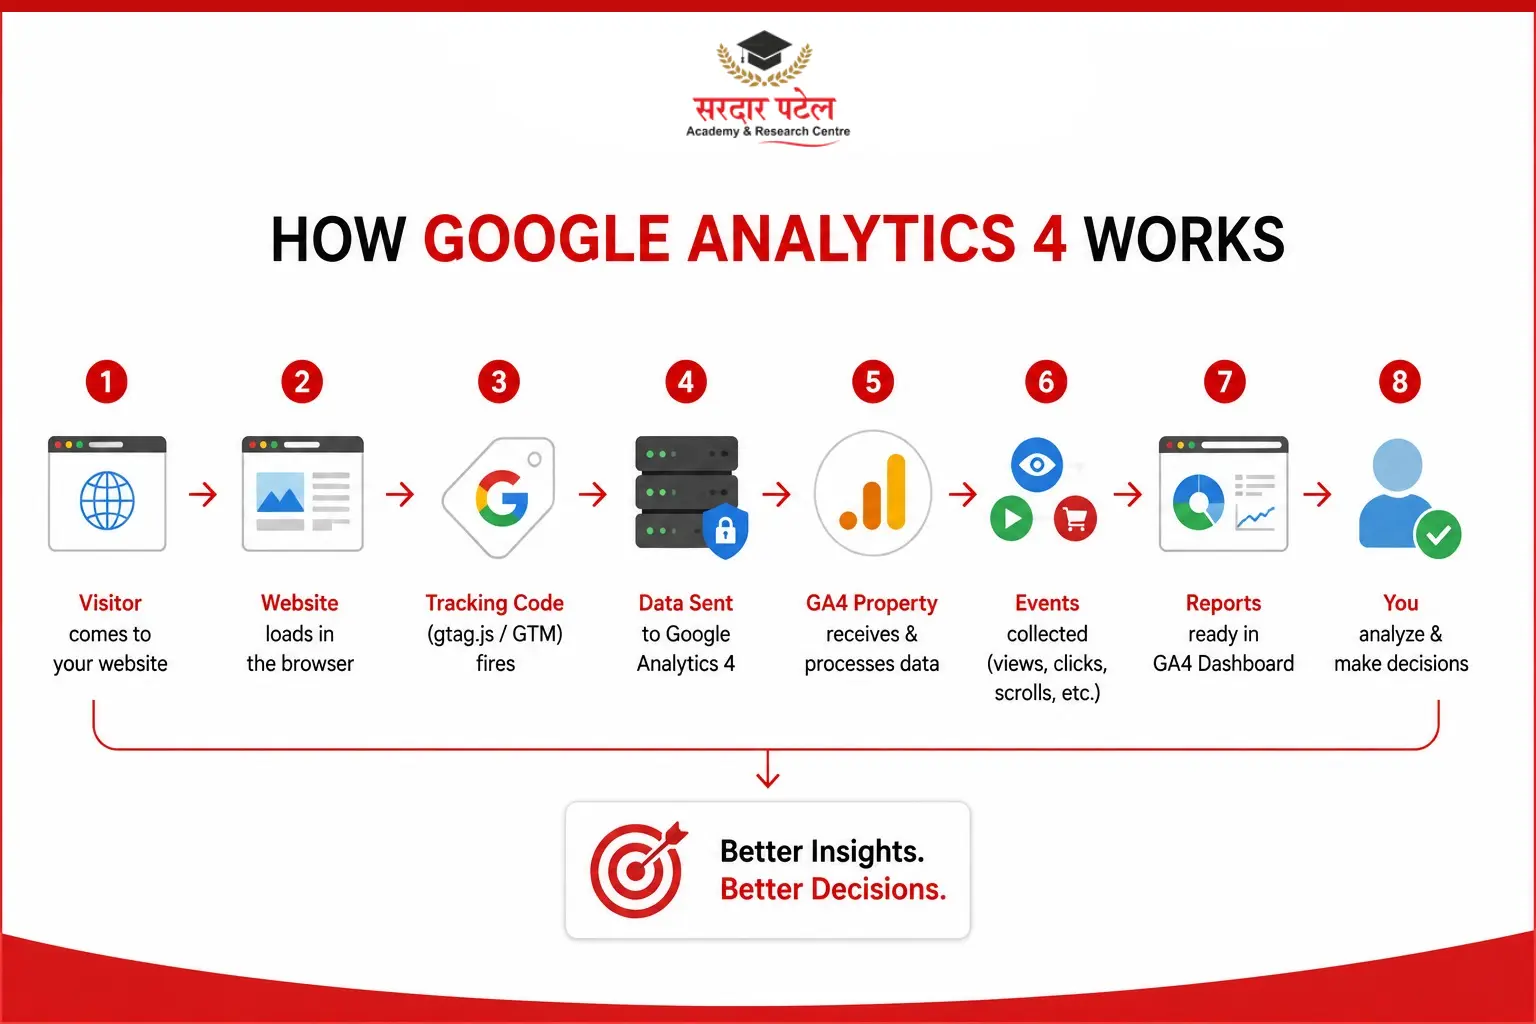
Mini Summary: No tracking code, no data. Installation accuracy matters more than any other step in this entire Google Analytics tutorial.
Tracking code installation is an important part of setting up analytics correctly, just as understanding technical SEO basics helps ensure that your website is properly structured and accessible to search engines.
How to Create a GA4 Account
Creating a GA4 account takes about ten minutes and involves four steps: creating a property, adding a data stream, installing the tracking code, and verifying it works. Getting this right the first time saves weeks of missing or broken data later.
Create Property
Go to analytics.google.com, click "Admin," then "Create Property." Enter your business name, time zone, and currency — this becomes the container for all your site's data.
Add Data Stream
Inside your new property, add a "Web" data stream and enter your website URL. GA4 will generate a unique Measurement ID (starts with "G-") that identifies your site specifically.
Install Tracking Code
Paste the generated tracking snippet into your website's section, or connect it through Google Tag Manager for more control. WordPress users can also use a plugin instead of editing code directly.
Verify Installation:
Use GA4's "Realtime" report and visit your own website in another tab. If your visit shows up within a minute, tracking is working correctly.
Quick Checklist:
- Property created with correct time zone
- Data stream added with correct URL
- Tracking code installed on every page
- Realtime report confirms tracking works
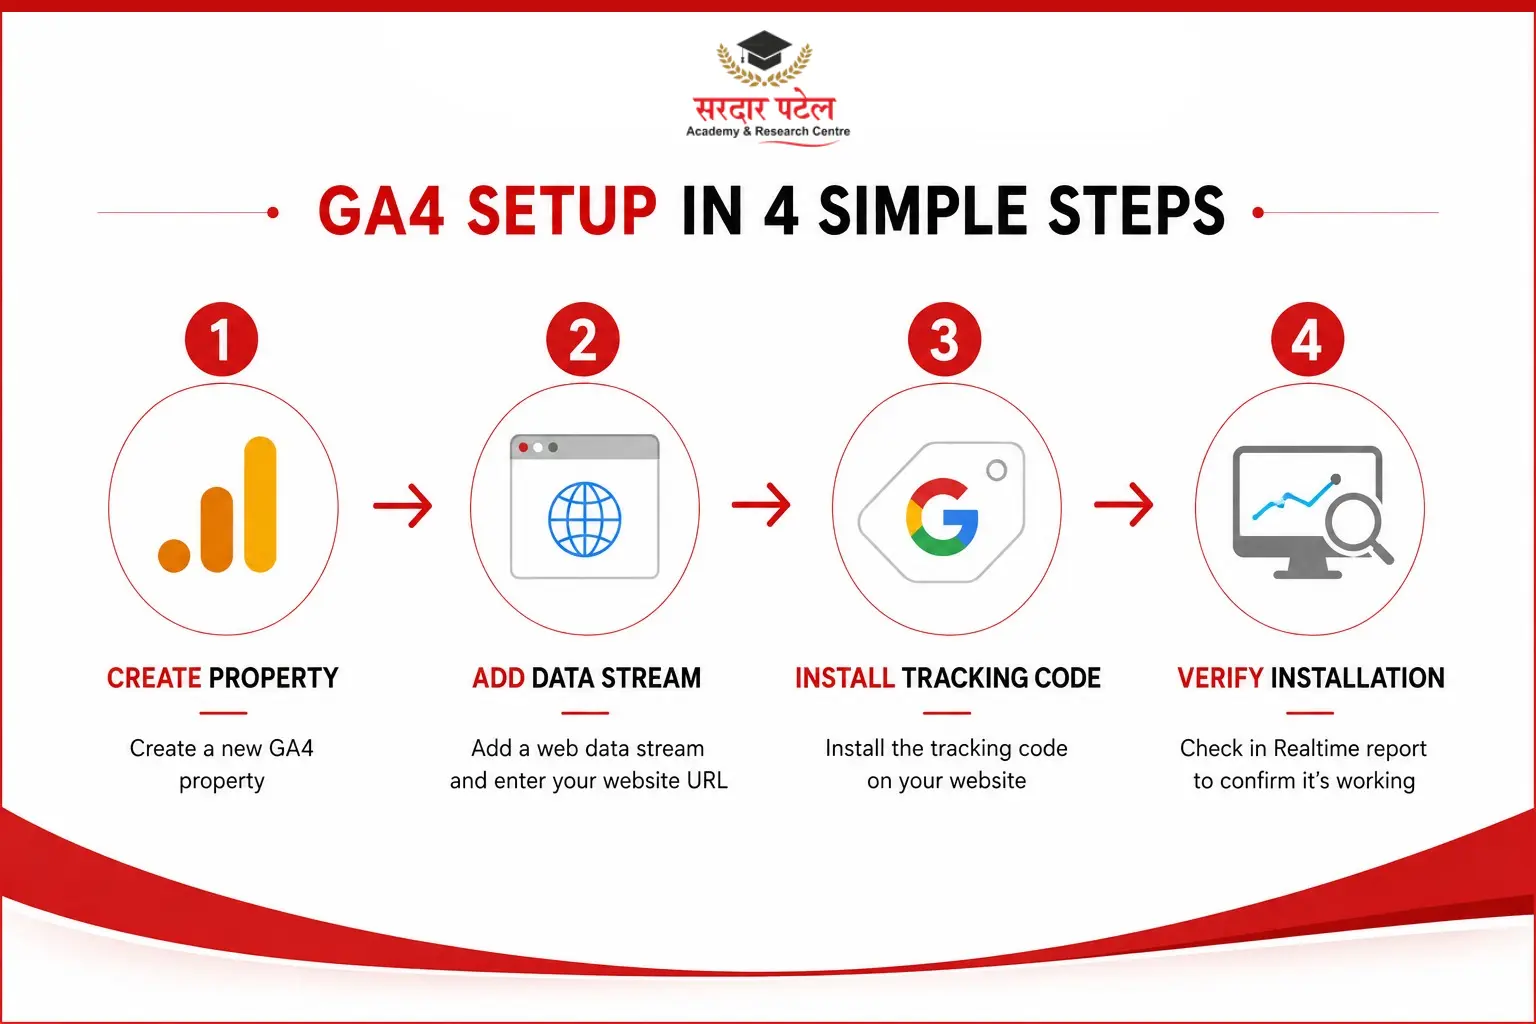
Table 1: Universal Analytics vs GA4
Source: Google Analytics Help, Google Search Central
Understanding the GA4 Dashboard
The GA4 dashboard is organised into five core sections — Home, Reports, Explore, Advertising, and Admin — each serving a different purpose, from quick snapshots to deep custom analysis. This part of the Google Analytics tutorial is where most beginners spend 80% of their time: just two sections, Reports and Realtime.
Home
Home gives a quick snapshot of recent performance, active users, and top events — useful for a fast daily check.
Reports
Reports is where most analysis happens, covering acquisition, engagement, monetisation, and retention in pre-built views.
Explore
Explore lets you build custom reports and funnels for questions the standard reports don't answer directly.
Advertising
Advertising shows how paid campaigns, especially Google Ads, are contributing to conversions and traffic.
Admin
Admin is where you manage settings — properties, data streams, user access, and integrations like Search Console.
Table 2: GA4 Dashboard Sections
Source: Google Analytics Help
Important GA4 Metrics Every Beginner Should Know
GA4 tracks dozens of metrics, but any solid Google Analytics tutorial only needs to cover eight to get beginners reading reports confidently — users, sessions, engaged sessions, engagement rate, events, conversions, traffic acquisition, and landing pages. Everything else builds on these fundamentals.
Users
Users count the number of distinct people visiting your site within a chosen date range.
Sessions
Sessions count visits, including repeat visits by the same user, showing overall activity volume.
Engaged Sessions
Engaged sessions count visits lasting 10+ seconds, with a conversion, or with 2+ page views — GA4's way of filtering out bounce-and-leave traffic.
Engagement Rate
Engagement rate is the percentage of sessions that were "engaged," and it's generally a more honest quality signal than the old bounce rate metric.
Events
Events are individual actions — clicks, scrolls, form submissions — that GA4 logs automatically or through custom setup.
Conversions
Conversions are events you've marked as meaningful business outcomes, like a purchase, form fill, or signup.
Traffic Acquisition
Traffic acquisition shows where visitors came from — organic search, paid ads, social, direct, or referral sources.
Landing Pages
Landing pages show which URLs visitors arrive on first, revealing which content actually attracts traffic.
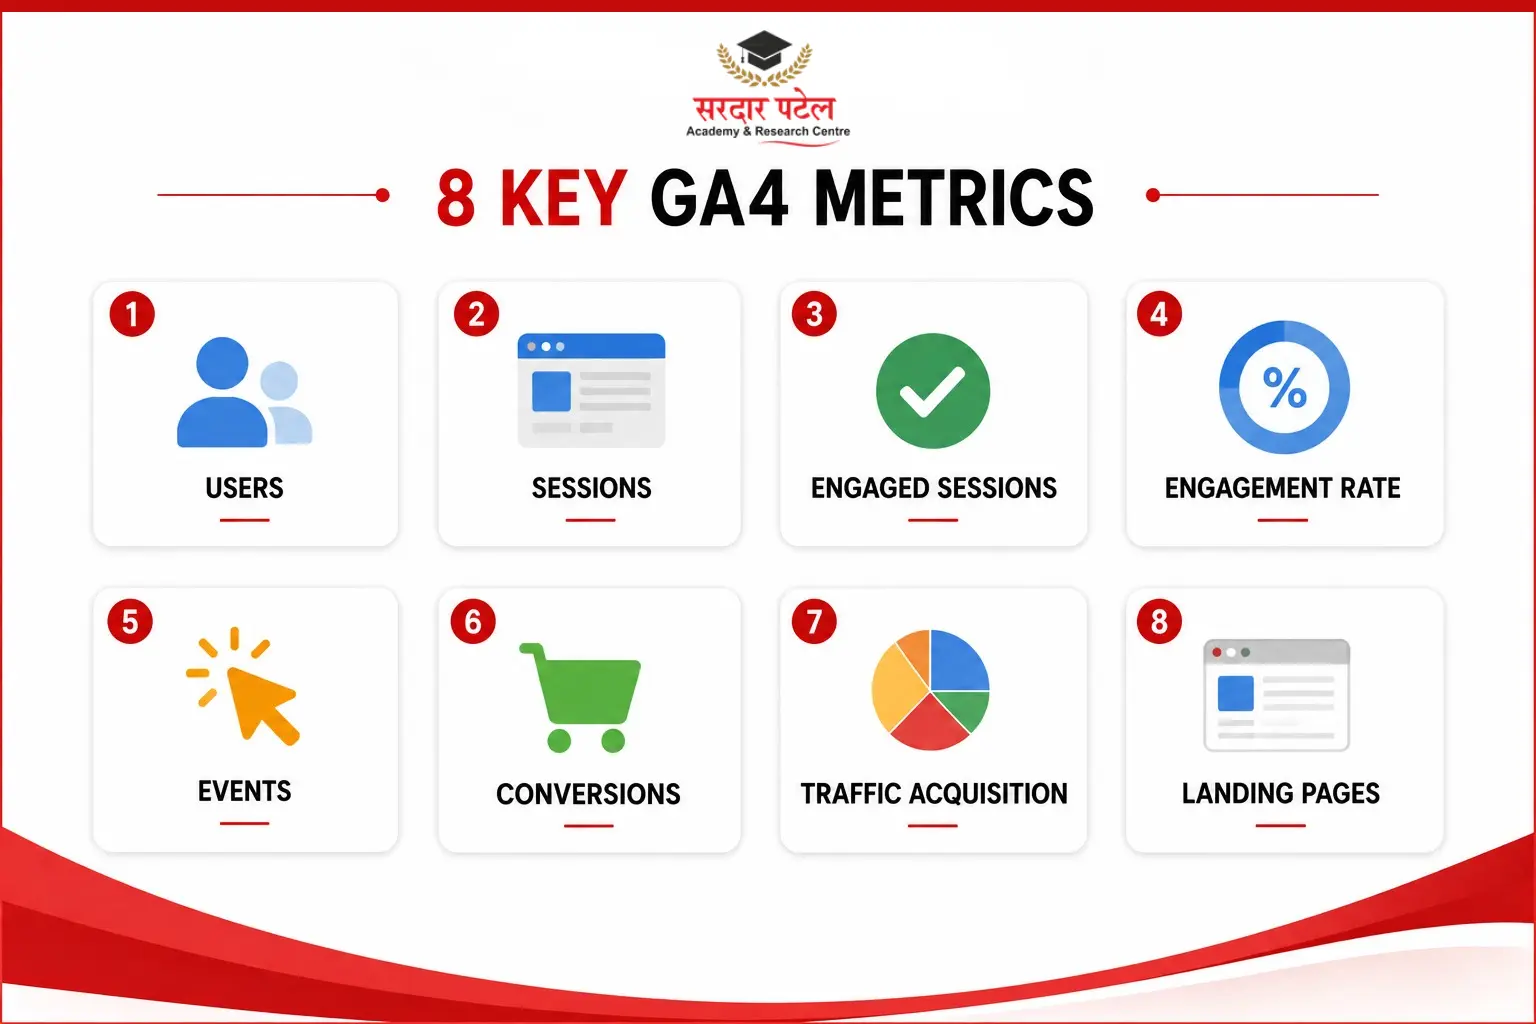
Table 3: Important Metrics
Source: Google Analytics Help
Table 4: Events vs Conversions
Source: Google Analytics Help, HubSpot
How to Read Google Analytics Reports
Reading GA4 reports well means starting broad — traffic and users — before narrowing into specific pages, sources, or conversion paths. This is the step most people skip when following a Google Analytics tutorial, jumping straight into Explore without understanding standard reports first — a common mistake that wastes time.
Step-by-step approach:
- Start with the Reports snapshot for a quick overview.
- Check Traffic Acquisition to see where visitors are coming from.
- Review Engagement reports to see which pages hold attention.
- Check Conversions to see what's actually working.
- Compare date ranges (week-over-week or month-over-month) to spot trends.
Pro Tip: Always compare data against a previous period. A single number without comparison tells you almost nothing.
How GA4 Helps SEO
Using GA4, SEO teams can evaluate visitor behaviour on organic pages and identify content that performs well beyond simply attracting traffic. Not just traffic volume — letting you prioritise content that's genuinely worth improving. Linking GA4 with Google Search Console adds keyword-level context that GA4 alone doesn't provide.
Practical use case: if a blog post gets high or
anic traffic but low engagement rate, that's a signal the content isn't matching search intent — a fix worth prioritising over writing something new.
Warning Note: Don't judge SEO content purely on traffic. A page with lower traffic but higher engagement and conversions is often more valuable.
Making it easier to understand whether your SEO basics are translating into meaningful results.

Common Beginner Mistakes
For beginners, accurate GA4 reporting starts with proper configuration. Small setup errors can affect the quality of the data and make later analysis less reliable. Fixing tracking errors after months of bad data is far harder than setting it up correctly the first time.
Common Mistakes:
- Installing tracking code on some pages but not all
- Never marking any events as conversions
- Ignoring the Realtime report during setup
- Comparing unequal date ranges and drawing wrong conclusions
- Not linking Search Console, missing keyword-level insight
Troubleshooting Tip: If Realtime shows zero visitors during your own test, check whether the tracking code is in the <head> section and whether a cookie consent tool is blocking it.
Accurate GA4 reporting begins with proper setup. Incorrect tracking or configuration can affect the quality of the data and lead to unreliable insights. Using an on-page SEO checklist alongside proper analytics tracking can help ensure your website's key optimisation elements are not overlooked.
Best Google Analytics Integrations
GA4 becomes significantly more useful once connected to Search Console, Google Ads, and Looker Studio, since each integration fills a gap GA4 doesn't cover alone. Search Console adds keyword data, Google Ads adds campaign-level ROI, and Looker Studio turns raw reports into shareable dashboards.
FAQs
Google Analytics is Google's free website tracking tool that records visitor activity — page views, clicks, and behaviour — and turns it into reports. It helps website owners understand who visits their site and what those visitors do.
GA4, or Google Analytics 4, is the current version of Google Analytics, built on an event-based tracking model instead of sessions. It replaced Universal Analytics, which stopped processing data on July 1, 2023.
Google Analytics works by placing a tracking code on your website that sends visitor activity to Google as events. GA4 processes this data and organises it into reports, usually visible within 24–48 hours of setup.
Beginners learn Google Analytics best through a structured google analytics tutorial combined with hands-on practice on a real or test website. Starting with the dashboard, then metrics, then reports — in that order — avoids the overwhelm most beginners hit.
The most important GA4 metrics for beginners are users, sessions, engaged sessions, engagement rate, events, conversions, traffic acquisition, and landing pages. These eight cover most beginner reporting needs.
Yes, Google Analytics is free for the vast majority of websites and businesses, which is exactly why this google analytics tutorial doesn't require any paid tools to follow along. A paid enterprise version, Google Analytics 360, exists only for very large organisations needing higher data limits and premium support.