+91 9312966129
 sparc.enquiry01@gmail.com


Is Coding Required for Data Analytics? A Clear Answer for Beginners
Is coding required for data analytics? See what freshers really need, from SQL and Excel to BI tools, and how to begin without feeling lost.

Table of Contents
Few questions stop beginners faster than this one: is coding required for data analytics? The honest answer is "it depends on the job you want", and that answer is more useful than it sounds.
Some analysts spend their days in spreadsheets and dashboards. Others write database queries before their first coffee. Both are real analytics careers. This guide shows where code helps, where it doesn't, and how to decide how much to learn, so you can plan your first months without guessing.
The Short Answer: Is Coding Required for Data Analytics?
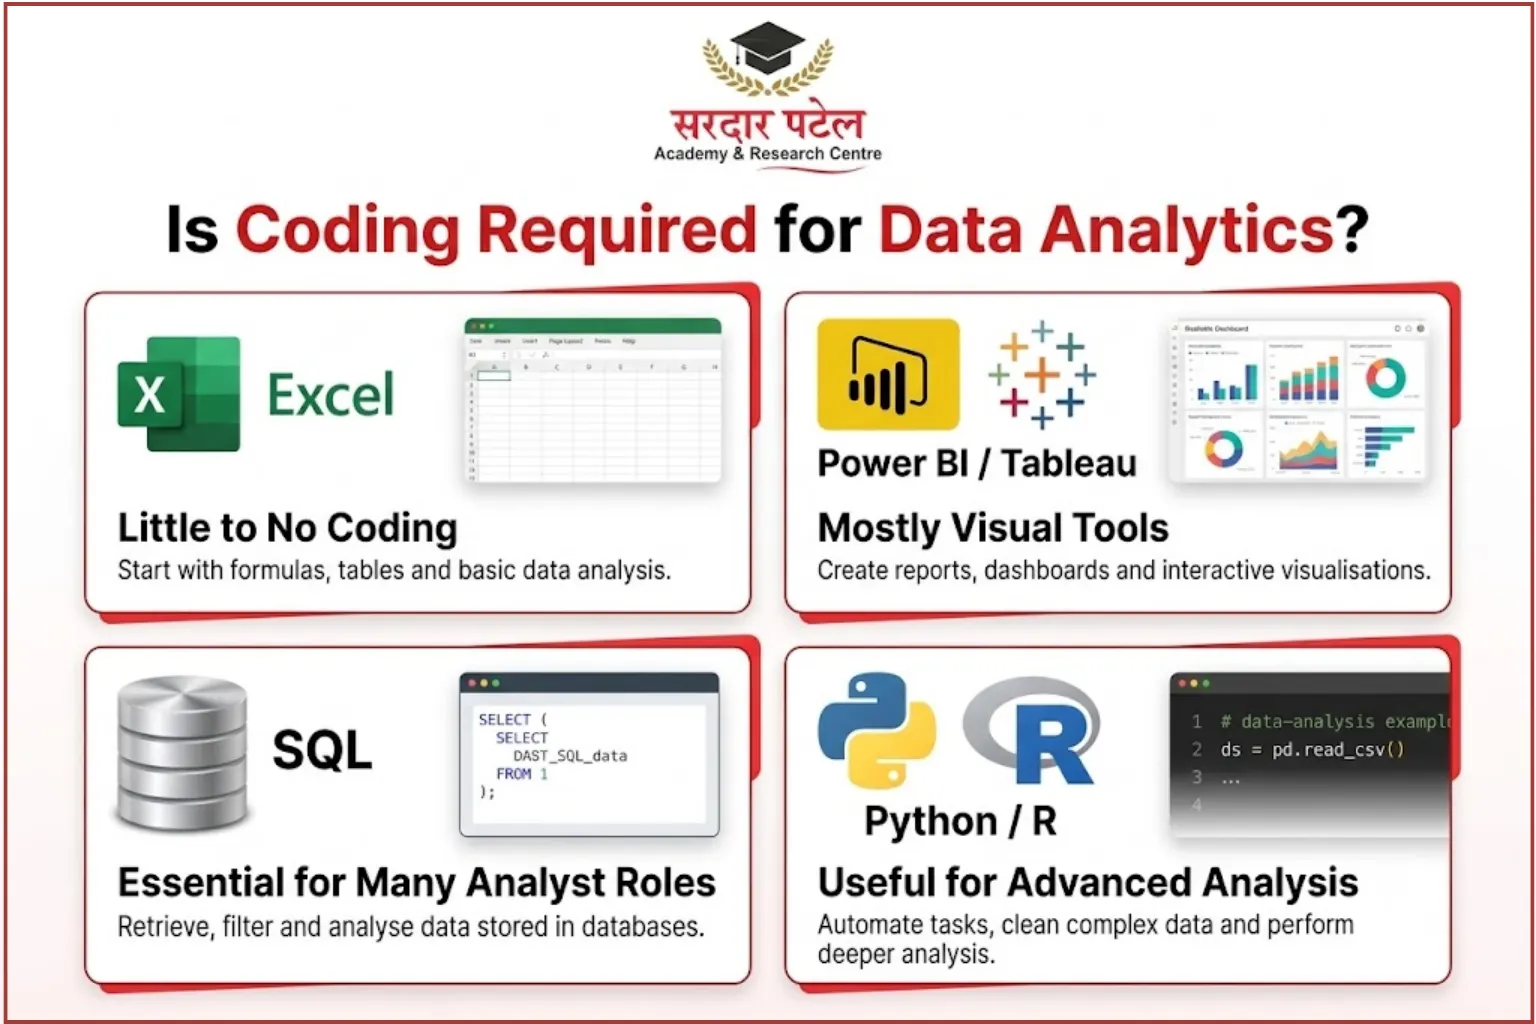
For most entry-level jobs, the coding required for data analytics comes down to one skill: basic SQL. You do not need to think like a software developer. You do need to pull data out of a database, and SQL is the language built for that. Beginners can practise basic queries using the official PostgreSQL SQL tutorial, which covers querying data, joins and other fundamentals.
Beyond SQL, the picture opens up. Excel, Power BI, and Tableau handle a large share of everyday reporting through formulas, menus, and drag-and-drop. Python and R become useful once a problem outgrows a spreadsheet.
So treat coding as a strong advantage rather than a gate you must clear on day one. Each new skill widens the range of problems you can solve, and the coding required for data analytics grows gradually with the responsibility you take on.
Where Coding Genuinely Helps
Skipping the coding required for data analytics is possible, but it narrows your options. Here is where code earns its place.
SQL: the skill most analysts end up needing
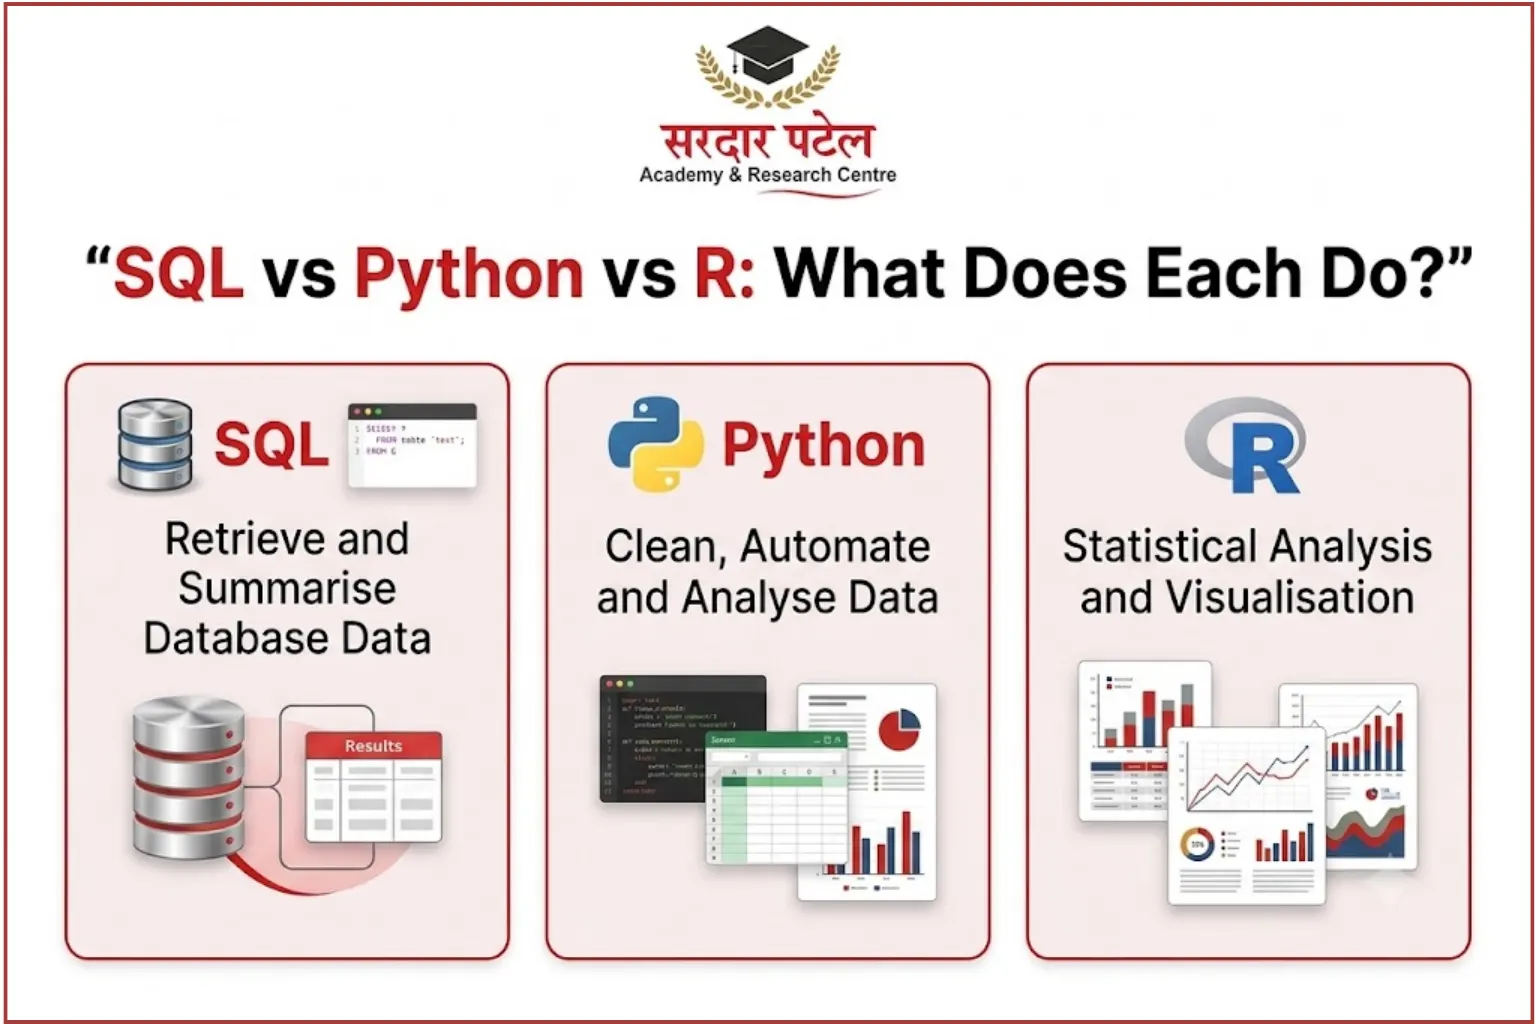
Business data usually lives in databases, not in files passed around by email. SQL lets you pull exactly the rows you need, join tables and summarise results. A question like "weekly orders by city" becomes a short query instead of a manual export. Our guide to the skills required to become a data analyst shows where SQL sits among the other fundamentals.
Python and R: for scale and repeatability
Python's pandas library can help clean, reshape and analyse tabular data. Beginners can follow the official pandas getting started tutorials to practise reading files, filtering data and calculating summary statistics.
Scripts also repeat the same steps every time, which helps when you must rebuild a report each month. R is also used for statistical analysis and graphics. You can explore its capabilities through the official R Project introduction, although most beginners are better off choosing just one programming language initially.
Analytics Without Programming: What Is Realistic
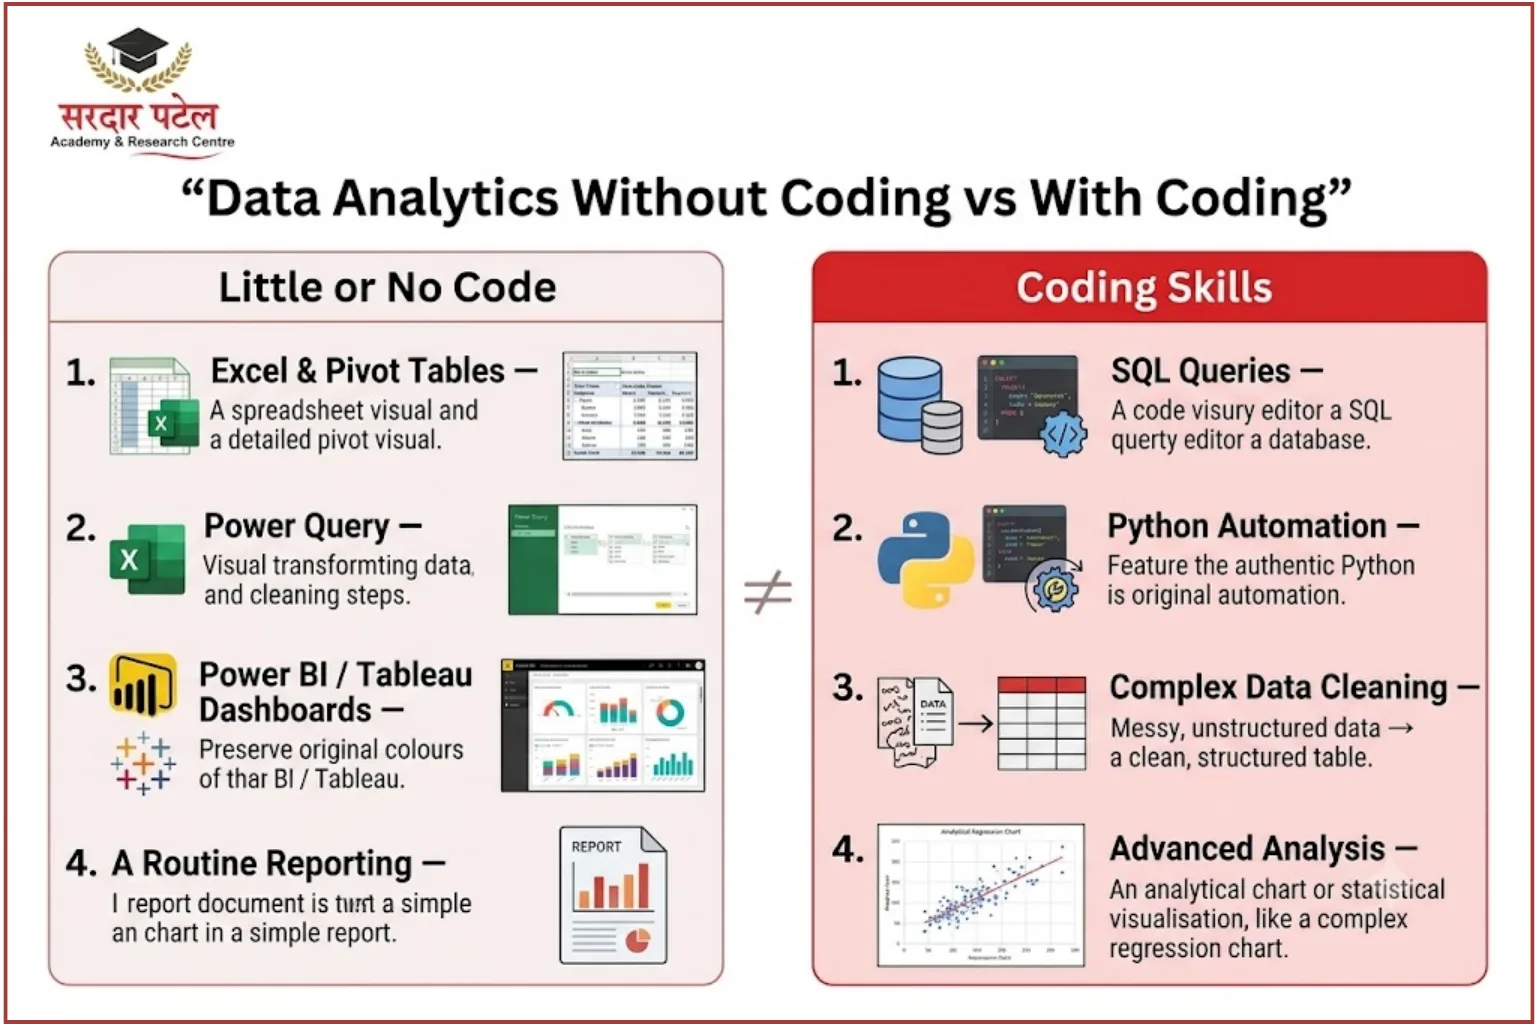
Analytics without programming is not a loophole. Many working analysts rely on tools designed for exactly that, so the coding required for data analytics is lighter in some jobs than in others.
| Task |
Tool that needs little or no code |
What it handles |
| Cleaning data |
Excel, Power Query |
Duplicates, spelling fixes, merging sheets |
| Quick analysis |
Pivot tables |
Grouping and summarising |
| Dashboards |
Power BI, Tableau |
Interactive charts and filters |
| Recurring reports |
Scheduled refresh |
Updating a report without rebuilding it |
Microsoft's Power BI learning resources offer guided training on connecting data, creating reports and building business intelligence dashboards.
One honest caveat: Power BI calculations use DAX, a formula language, so "no code" really means "very little code".
Analytics without programming works well for reporting and business analysis. It becomes limiting when data is huge, very messy, or needs automation. If this route appeals to you, read our guide to a Data Analytics Career Without Coding to understand the available roles, required skills, and career opportunities.
How Coding Needs Differ by Role
The coding required for data analytics varies far more by job title than most beginners expect. To explore related occupations and their typical work activities, you can also consult O*NET OnLine, a resource for occupational information.
| Role |
Typical coding level |
What employers often expect |
| Business analyst |
Light |
Excel, basic SQL |
| BI or reporting analyst |
Light to moderate |
SQL, Power BI or Tableau |
| Data analyst |
Moderate |
SQL, often some Python |
| Junior data scientist |
Heavy |
Python, statistics, machine learning basics |
This is a general pattern, and individual employers differ, so job postings remain your best guide.
Here is a small example. A retail business analyst might open a weekly sales extract in Excel, build a pivot table, and share a chart. On a busy week, a short SQL query pulls the same figures straight from the database. That is not programming in the traditional sense, yet it is the coding required for data analytics in this role.
A Practical Way to Decide
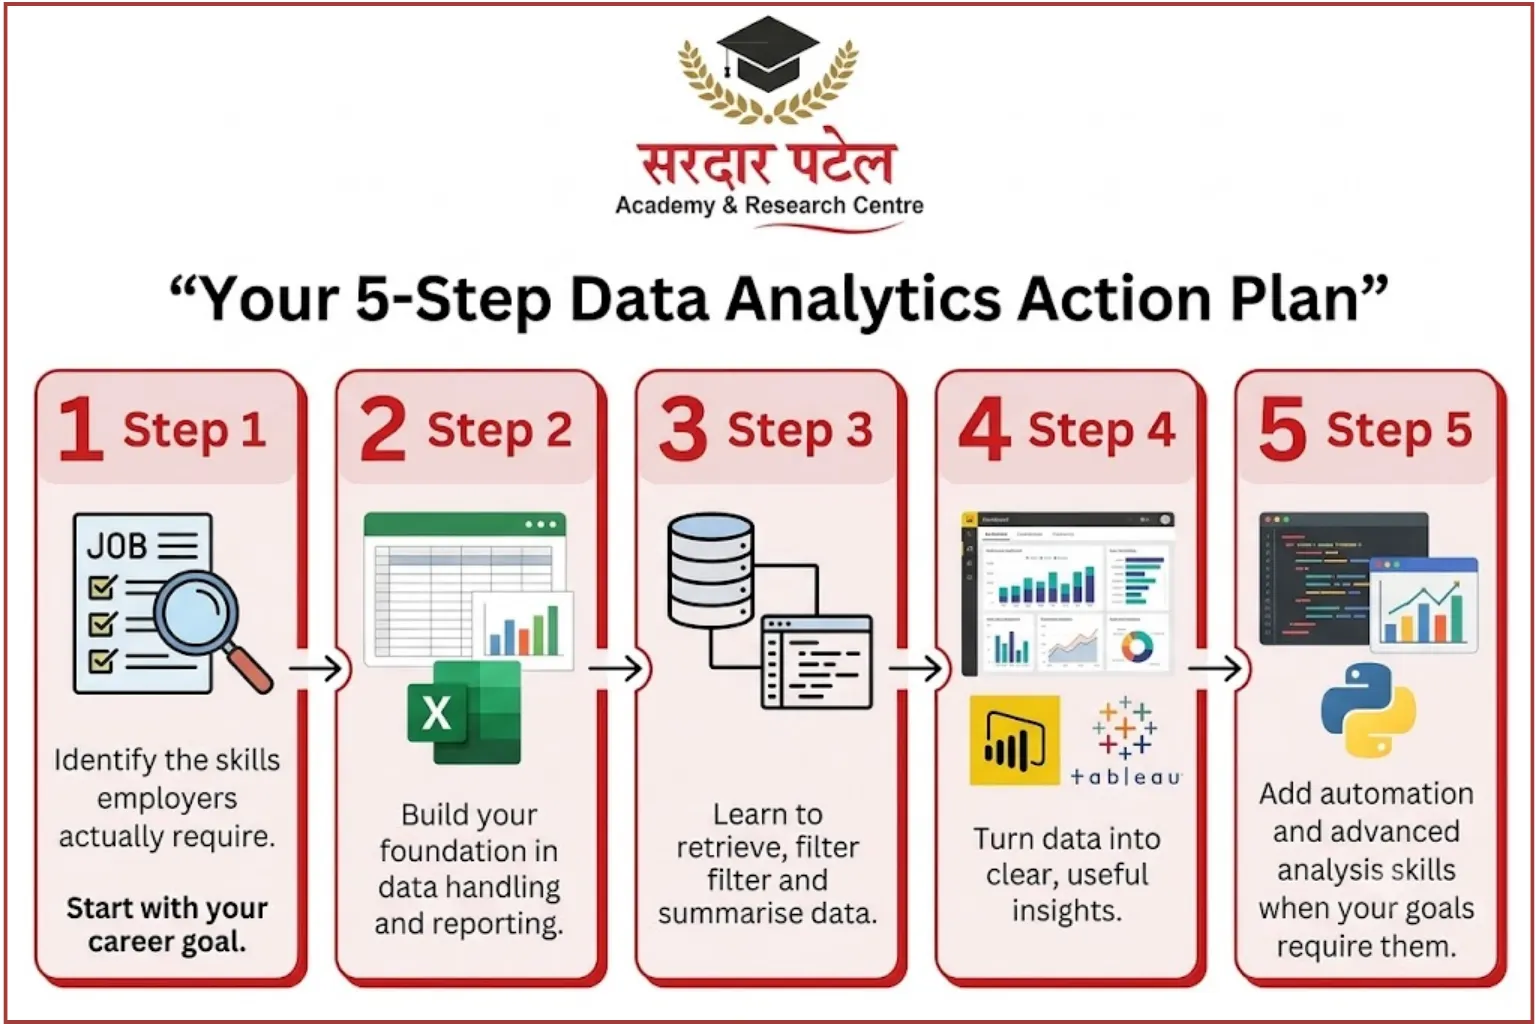
- Read ten job postings for roles you actually want. Note how often SQL, Python or specific BI tools appear.
- Start with spreadsheets. Pivot tables and lookups teach you to think in tables.
- Add basic SQL early. Filtering, grouping, and joins cover most of the coding required for data analytics at entry level.
- Pick one BI tool and build a small dashboard from a real dataset. To practise with real-world-style data, explore Kaggle Datasets and choose a small dataset for your first dashboard project.
- Python only when a task demands it, such as merging several files you cannot handle by hand.
Timelines differ from person to person, so read our guide on Data Analytics Course Duration to understand how long it may take to learn the essential skills. If you prefer classroom guidance, a data analytics course in Delhi can help you practise with real datasets. For another perspective on beginner learning paths, explore Google's Data Analytics Certificate, which covers spreadsheets, SQL, data visualisation and other foundational skills.
Sardar Patel Academy & Research Centre offers a data analytics programme built around guided, hands-on practice for learners who like to study with support.
Mistakes to Avoid
- Waiting to feel ready. Nobody feels ready. Write a small query this week.
- Starting with Python before SQL. Most analyst roles need data retrieval first.
- Treating the coding required for data analytics as all or nothing. It is a gradual climb, not a cliff.
- Avoiding code out of fear. Basic SQL is closer to reading a sentence than to software engineering.
- Believing no-code means no thinking. Tools speed up the work, but the questions still come from you.
- Collecting tools. Depth in two or three beats a shallow look at ten.
Conclusion
So, is coding required for data analytics? Not on day one, and not at the same depth for every role. SQL is the one skill worth planning for, while Python can follow when your work demands it.
The coding required for data analytics is learnable at any age and from any background. Start with spreadsheets, add SQL, build a dashboard and let real projects decide what comes next. When you are ready for guided practice, you can join our beginner-friendly analytics course and learn at a pace that suits you.
FAQs
Usually only basic SQL. Many fresher roles also value Excel and a BI tool more than programming, though this varies by employer.
You can start in reporting-focused roles using Excel and BI tools. Over time, the coding required for data analytics, mainly SQL, becomes hard to avoid, so plan to learn it.
SQL, in most cases. It is the more common entry-level requirement, and Python makes more sense once you have real data problems to solve.
Excel is a solid starting point for small datasets. When data grows or must be refreshed regularly, SQL and a BI tool become the natural next step.
No. Comfort with percentages, averages and logic is enough to begin. Statistics can be learned alongside practice.
They can draft queries or scripts, but you still have to check the output. Understanding the logic helps you spot wrong answers.