+91 9312966129
 sparc.enquiry01@gmail.com


In-Demand Analytics Skills Employers Want
Explore the in-demand analytics skills employers want, from SQL and Excel to BI tools, with a practical learning path for freshers and career switchers.

Open ten data analyst job postings and a pattern appears. Titles and industries change, yet the requirements keep circling back to the same handful of abilities. Knowing which in-demand analytics skills genuinely matter, and which are just bonus points, can save you months of scattered learning.
This report covers the in-demand analytics skills employers ask for across tools, thinking and communication. It shows how each one is used at work, how they combine on a real problem, and in what order to learn them. Whether you are a student, a fresher or a career switcher, treat it as a map rather than a weekend checklist. If you're new to the field, start with our data analytics beginner guide to understand the fundamentals before exploring individual skills.
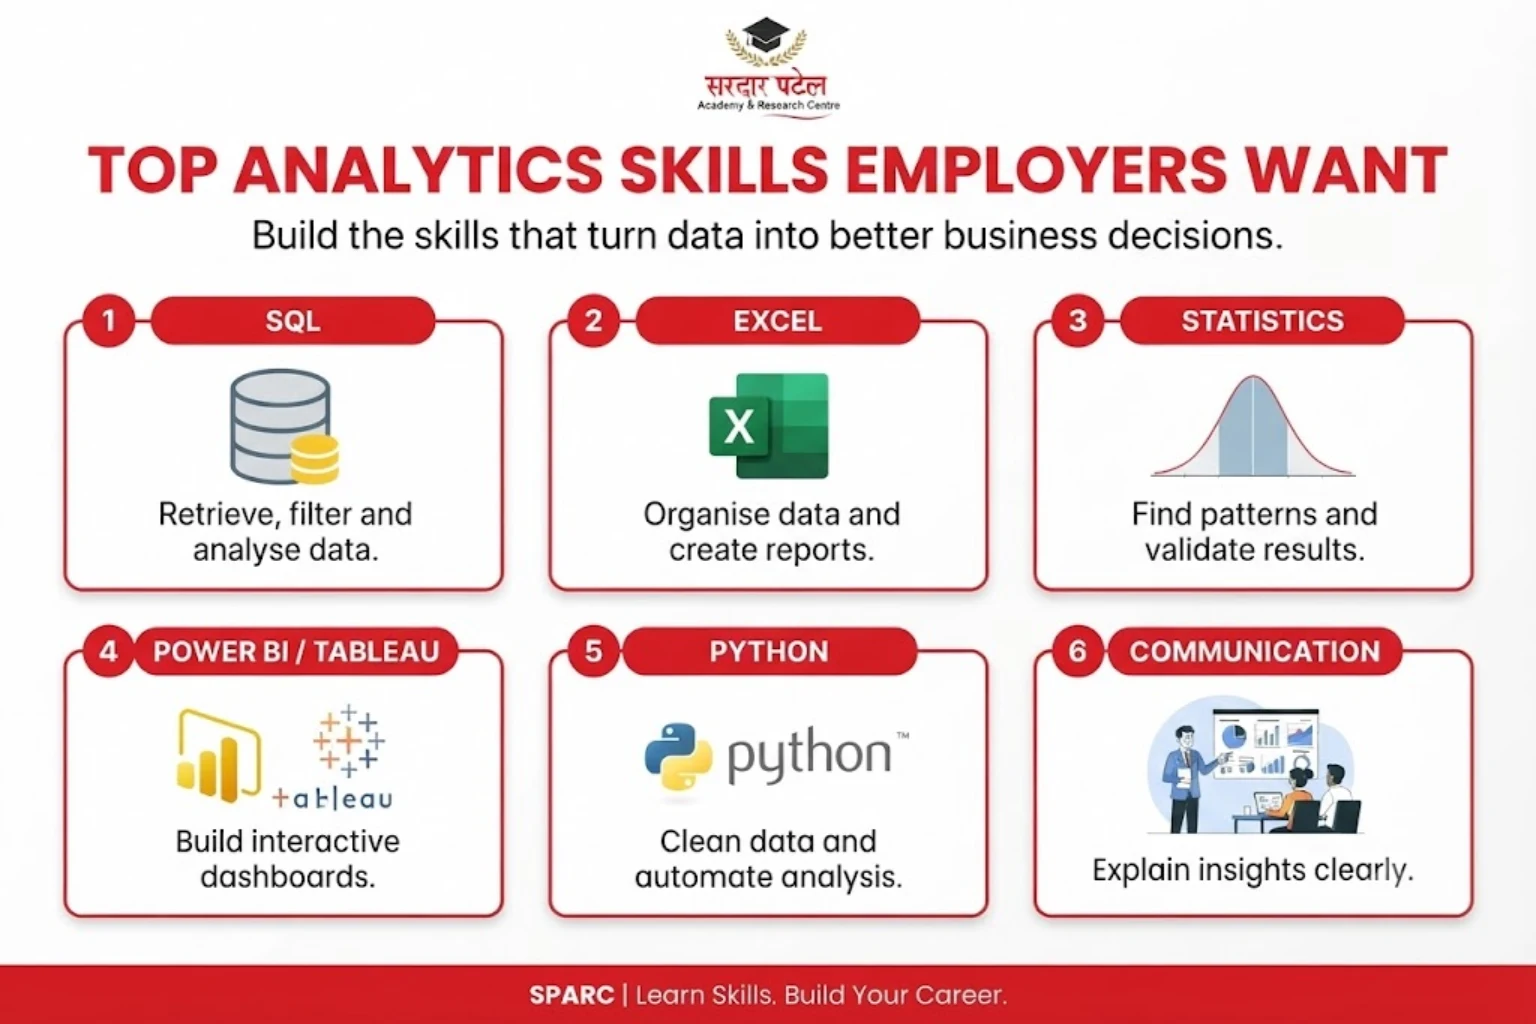
The short answer: most analyst roles revolve around SQL, Excel, statistics, one BI tool such as Power BI or Tableau, and Python, held together by the ability to explain findings clearly. Tools get you shortlisted. Judgment and communication get you hired.
Why In-Demand Analytics Skills Matter
Almost every business records something: orders, app clicks, support tickets, deliveries, fee payments. Records alone improve nothing. Someone has to clean them, ask sharp questions, and turn the findings into a decision a manager can act on.
That gap between raw data and a confident decision is where in-demand analytics skills create value. Employers are not really hiring for tool names. They are hiring for the ability to reduce uncertainty.
Demand also varies by sector. Banking leans on risk and reporting, e-commerce on funnels and inventory, healthcare on patient flow and operations. The core toolkit stays similar, but the questions change, so it helps to pick a domain you genuinely enjoy.
How Hiring Managers Read a Skill List
A resume listing ten tools rarely impresses. Evidence does: a dashboard you built, a messy file you cleaned, a business question you answered. Tools may get you past screening, but the top skills for data analyst jobs are proven in interviews and practical tasks, where you explain your reasoning out loud.
Core Technical Skills
These are the in-demand analytics skills that appear in job descriptions again and again. “To explore the tools used in analytics workflows, see our guide to data analytics tools you must know.”
SQL: Getting Data Out of Databases
Most business data sits in databases, and SQL is how you retrieve it. Joins, grouping, filtering, subqueries, and window functions are everyday work. It is a common focus in analyst interviews, so practising with SQL interview questions for freshers pays off early.
Beginners can practise basic SQL queries using Microsoft's introductory SQL learning module.
Excel and Spreadsheets
Spreadsheets are still everywhere, especially in finance, operations, and small teams. Pivot tables, lookup functions and quick charts let you answer routine questions in minutes. For more advanced data preparation, explore Microsoft's guide to Power Query and Power Pivot in Excel. Good spreadsheet habits, such as clean headers, consistent formats, and documented formulas, also carry over to every other tool you will use.
Python for Analysis
Python, particularly the pandas library, helps you clean, merge, and reshape data that would overwhelm a spreadsheet. Begin with reading files, handling missing values, and basic plots before touching anything advanced. To practise these tasks, follow the official pandas getting-started tutorials for working with and analysing tabular data.
Statistics and Probability
Averages can mislead. Suppose sales rise after a campaign: was it the campaign, or simply festival season? Understanding distributions, sampling, correlation versus causation and hypothesis testing protects you from confident but wrong conclusions.
Data Visualization and BI Tools
Tools such as Power BI and Tableau turn tables into dashboards. A good dashboard answers one clear question at a glance. A bad one shows everything and explains nothing.
Beginners can explore Microsoft's Power BI getting-started documentation to learn about reports, dashboards, and the available learning paths.
Data Cleaning and Preparation
Real data has duplicates, blanks and inconsistent spellings, such as "Delhi", "delhi " and "New Delhi" in the same column. Preparing it often takes a big chunk of an analyst's time, which is why employers value people who do it carefully.
| Skill |
Typical use at work |
Sample task |
Learning priority |
| SQL |
Pulling data from databases |
Weekly orders by city |
High, start early |
| Excel |
Quick analysis and reporting |
Pivot of monthly expenses |
High |
| Statistics |
Checking whether a result is real |
Comparing two campaigns |
High, learn alongside |
| BI tools |
Dashboards for decision-makers |
Sales performance view |
Medium to high |
| Python |
Cleaning and automation |
Merging three files |
Medium to high |
| Data cleaning |
Fixing quality issues |
Removing duplicate customers |
Constant |
For a fuller breakdown of the basics, see our guide to the skills required to become a data analyst.
Putting the Skills Together: A Worked Example
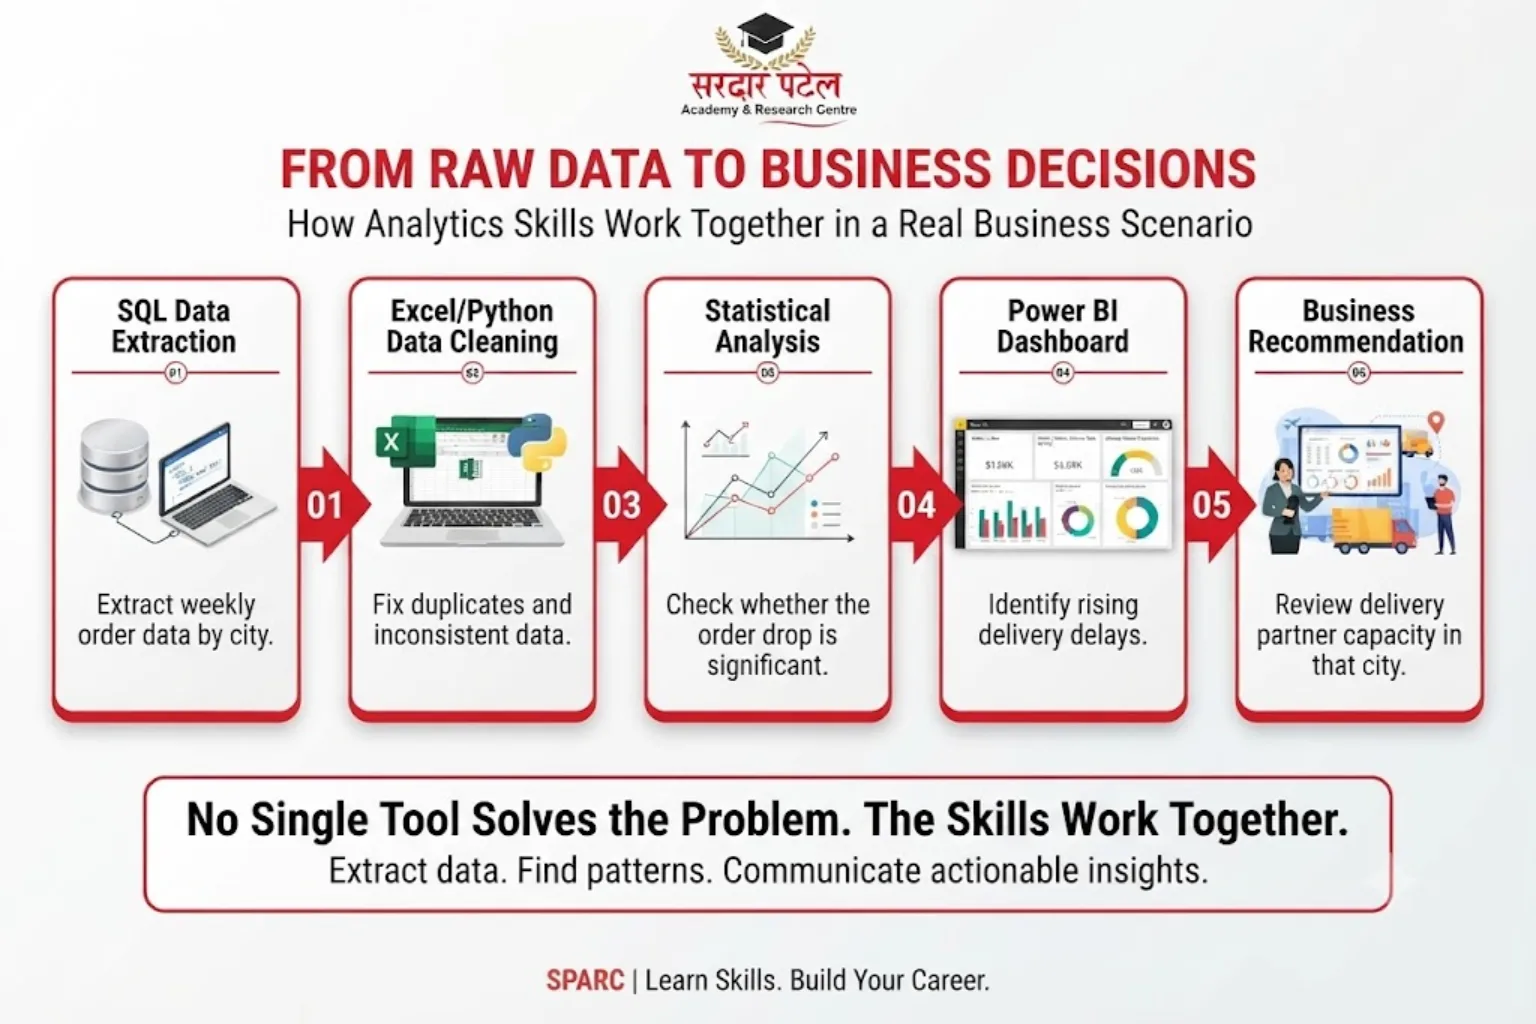
Imagine an online grocery store notices falling orders in one city. SQL pulls weekly order data by area. Python or Excel removes duplicates and fixes inconsistent area names. Statistics checks whether the drop is larger than normal weekly variation. A dashboard then shows delivery delays rising in the same weeks.
Finally, communication turns all of this into a recommendation: review delivery partner capacity in that city. No single tool solved the problem; the chain did. That is why in-demand analytics skills are valued as a combination rather than as separate boxes to tick. “Understanding the key steps in the data science process can help you see how data moves from collection and preparation to analysis and insights.”
Skills That Go Beyond the Toolbox
Technical ability explains how you work. The in-demand analytics skills outside the toolbox decide whether your work actually gets used.
- Business understanding: Knowing what a retailer means by "returns" or a school by "retention" leads to better questions.
- Communication: "Returns rose in one category" is only a fact. "Returns rose because one size runs small, so the size chart needs an update" is an insight.
- Critical thinking: Question the data source, the time period and your own assumptions.
- Attention to detail: One careless join can quietly double a revenue figure.
- Collaboration: Analysts work with marketing, finance, product and engineering teams, so clear questions and patient listening matter.
Emerging Skills Worth Watching
New trends keep adding to the list of in-demand analytics skills, but they build on the fundamentals rather than replace them.
- Cloud data platforms: Basic familiarity with cloud-based warehouses and storage.
- Report automation: Scheduling refreshes instead of rebuilding the same report by hand.
- AI-assisted analysis: Using AI tools to draft queries or code, then verifying every result yourself. “Learn more about how AI tools are changing data analytics and the ways they support analytical workflows.”
- Data privacy awareness: Handling customer information responsibly.
Skills by Job Role
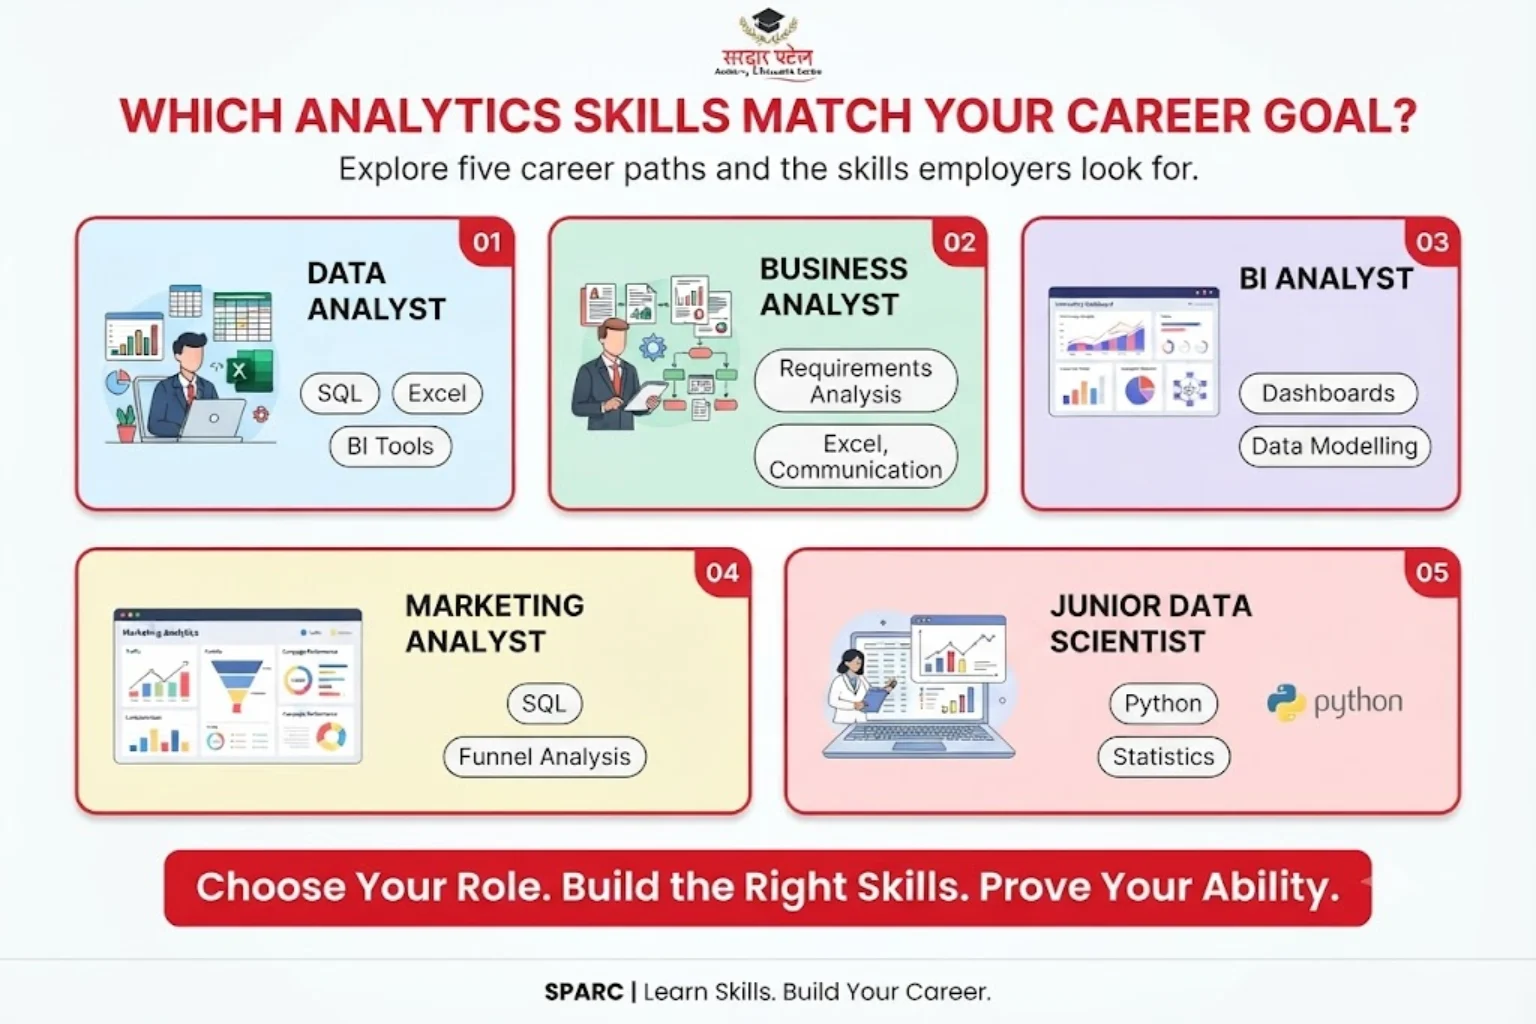
Mapping in-demand analytics skills to a role helps you decide what to learn first. “For a broader view of career options, required skills and earning potential, read our guide to data analytics career scope, skills and salaries.
| Role |
Main emphasis |
Supporting skills |
| Data analyst |
SQL, Excel, BI tools |
Statistics, storytelling |
| Business analyst |
Requirements, Excel, communication |
SQL, process knowledge |
| BI analyst |
Dashboards, data modelling |
SQL, data cleaning |
| Product or marketing analyst |
SQL, funnel and experiment analysis |
Visualization, communication |
| Junior data scientist |
Python, statistics |
SQL, machine learning basics |
These roles are common starting points. With experience, analysts often move into specialist paths such as BI development or data science, or into leadership roles leading analytics teams.
A Step-by-Step Learning Path
The order in which you pick up in-demand analytics skills matters as much as the skills themselves. “For a structured overview of what to learn and how to progress, follow our data analytics learning guide.”
- Start with spreadsheets. Build comfort with tables, pivots and basic charts.
- Add SQL. Practise on realistic datasets until joins feel natural.
- Learn statistics alongside. Keep it practical: summaries, distributions, and simple tests.
- Pick one BI tool. Depth in Power BI or Tableau beats a shallow look at both.
- Move to Python. Focus on data handling before anything fancier.
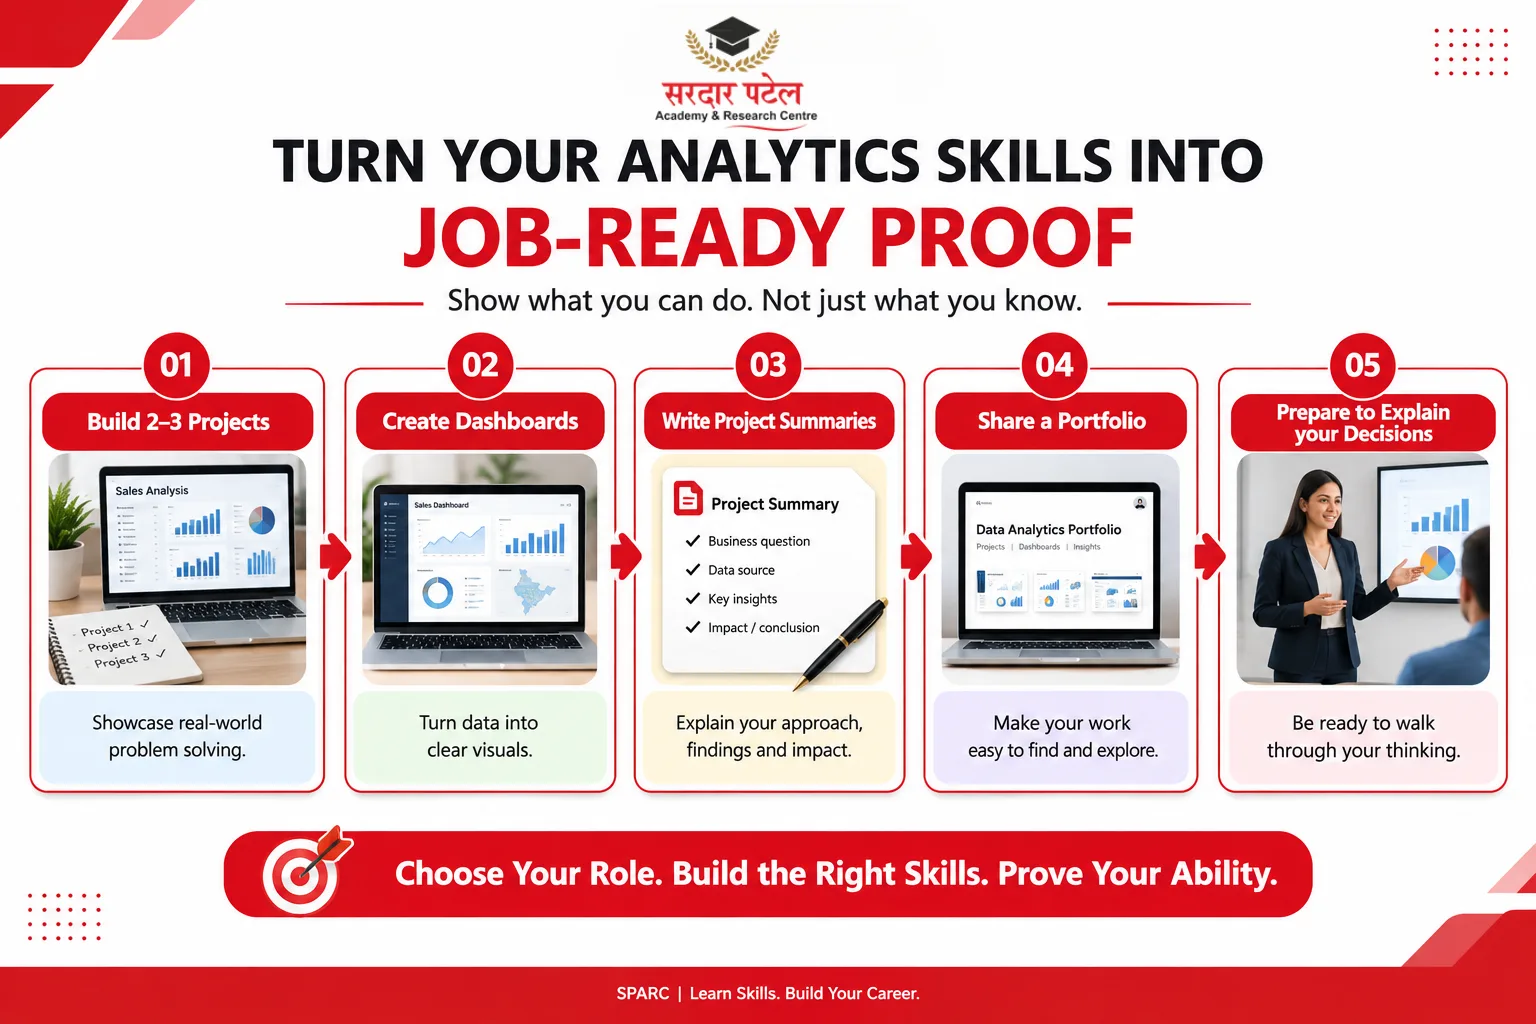
- Build projects. Projects are where in-demand analytics skills turn into visible proof. Two or three well-explained ones beat a long list of certificates.
- Rehearse interviews. Practise explaining your process aloud, not just writing queries.
Self-study works for some people. Others progress faster with structured, mentored practice. If you are comparing options, look at a data analytics course in Delhi and read the parents' feedback on data analytics training before deciding. Sardar Patel Academy & Research Centre runs a data analytics programme for learners who prefer guided, hands-on practice.
How to Show Your Skills to Employers
Listing skills is easy. Proving them takes a little packaging.
- Write one-page project summaries: State the question, the data you used, your method and what you recommend.
- Share your work publicly: A portfolio page or code repository lets recruiters check your claims for themselves.
- Tailor your resume: Mirror the top skills for data analyst jobs named in each posting, but only those you can discuss confidently.
- Prepare to be questioned: Be ready to explain why you chose a particular join, chart or statistical test.
Done well, this turns a list of in-demand analytics skills into a story an interviewer can follow.
Common Mistakes to Avoid
Most learners do not fail for lack of effort. They stumble in how they build in-demand analytics skills.
- Collecting tools like trophies: Treating the list as logos to collect instead of problems you can solve.
- Skipping statistics: Charts look convincing even when the conclusion is wrong.
- Tutorial loops: Watching without building leaves you stuck at the first unfamiliar dataset.
- Ignoring communication: An unexplained dashboard rarely changes a decision.
- Rushing into machine learning: Weak SQL and cleaning habits will undermine any model.
Conclusion
Strong analytics careers rarely come from mastering a single tool. They come from reliable technical basics, sound statistical judgment and the ability to explain findings plainly. At heart, in-demand analytics skills are about helping people make better decisions with evidence.
Start with SQL and Excel, add statistics and a BI tool, build a few projects, and keep refining how you communicate. When you want guided, practical training, you can build industry-ready skills through the data analytics course at SPARC. Have questions? Call us on +91 93129-66129 to talk to our team.
FAQs
SQL, Excel, basic statistics, one BI tool and clear communication form the foundation. Python usually follows once these feel comfortable.
Not on day one. Excel and BI tools are a gentle start. Most analyst roles, however, expect SQL fairly soon, and Python becomes useful as your tasks grow.
SQL, in most cases. Nearly every analyst role involves retrieving data, and SQL is the more common requirement in entry-level postings.
Either is a sound choice. Check which one appears most in the postings you are targeting and learn that one well. Data modelling and dashboard design concepts transfer easily to the other.
It depends on your background, weekly practice hours, and project work. Consistent practice with real datasets matters more than any fixed timeline.
Yes. Analysis that nobody understands rarely influences a decision, so employers look for people who can explain findings simply.
Yes. Most analytics tools can be learned from scratch, and domain knowledge from commerce, healthcare, education or marketing is a real advantage.