+91 9312966129
 sparc.enquiry01@gmail.com


Data Analytics Project Ideas for Students
Explore practical data analytics project ideas for students, complete with tools, datasets, and skills learned — perfect for building a beginner-friendly portfolio.

Table of Contents
- Why Students Should Build Data Analytics Projects
- How to Choose a Data Analytics Project
- Best Data Analytics Project Ideas for Students
- Sales Data Analysis Project
- Customer Churn Analysis
- E-commerce Dashboard
- Student Performance Analysis
- Marketing Campaign Analysis
- Financial Data Analysis
- HR Analytics Project
- Inventory Analysis
- Website Traffic Analysis
- Social Media Analytics Project
- Quick Comparison Table
- Where to Find Data for These Projects
- How These Projects Help Build a Portfolio
- Common Mistakes Students Should Avoid
- Tips for Presenting Analytics Projects
- Conclusion
If you're a student trying to break into the data field, the fastest way to build real skills is by working on actual data analytics project ideas rather than just finishing another course. Recruiters and hiring managers want to see that you can take a raw dataset and turn it into something useful — and that's exactly what a well-chosen project demonstrates. This article walks through a set of practical data analytics project ideas for students, along with the tools, skills, and portfolio value each one offers.
Whether you're just getting started or looking to add depth to an existing portfolio, these projects are designed to be approachable, realistic, and genuinely useful for learning. If you're new to the field, start with this beginner-friendly introduction to data analytics before choosing a project.
Why Students Should Build Data Analytics Projects
Coursework teaches concepts, but projects teach application. When you work through one on your own, you run into messy data, unclear questions, and design decisions that no textbook prepares you for — and that's precisely the experience employers value.
Building projects also gives you something concrete to talk about in interviews. Instead of saying "I learned SQL," you can say "I used SQL to analyze churn patterns in a subscription dataset and found that customers who didn't use the app in their first two weeks were far more likely to cancel." That kind of specific, project-based story is far more convincing than a list of skills on a resume.
For students exploring beginner analytics project topics for the first time, this hands-on approach also builds confidence. You start to understand how data cleaning, analysis, and visualization actually connect, instead of learning each step in isolation. For students who want to strengthen this foundational skill, a data cleaning tutorial for beginners can be a useful next step before taking on more complex projects.
How to Choose a Data Analytics Project
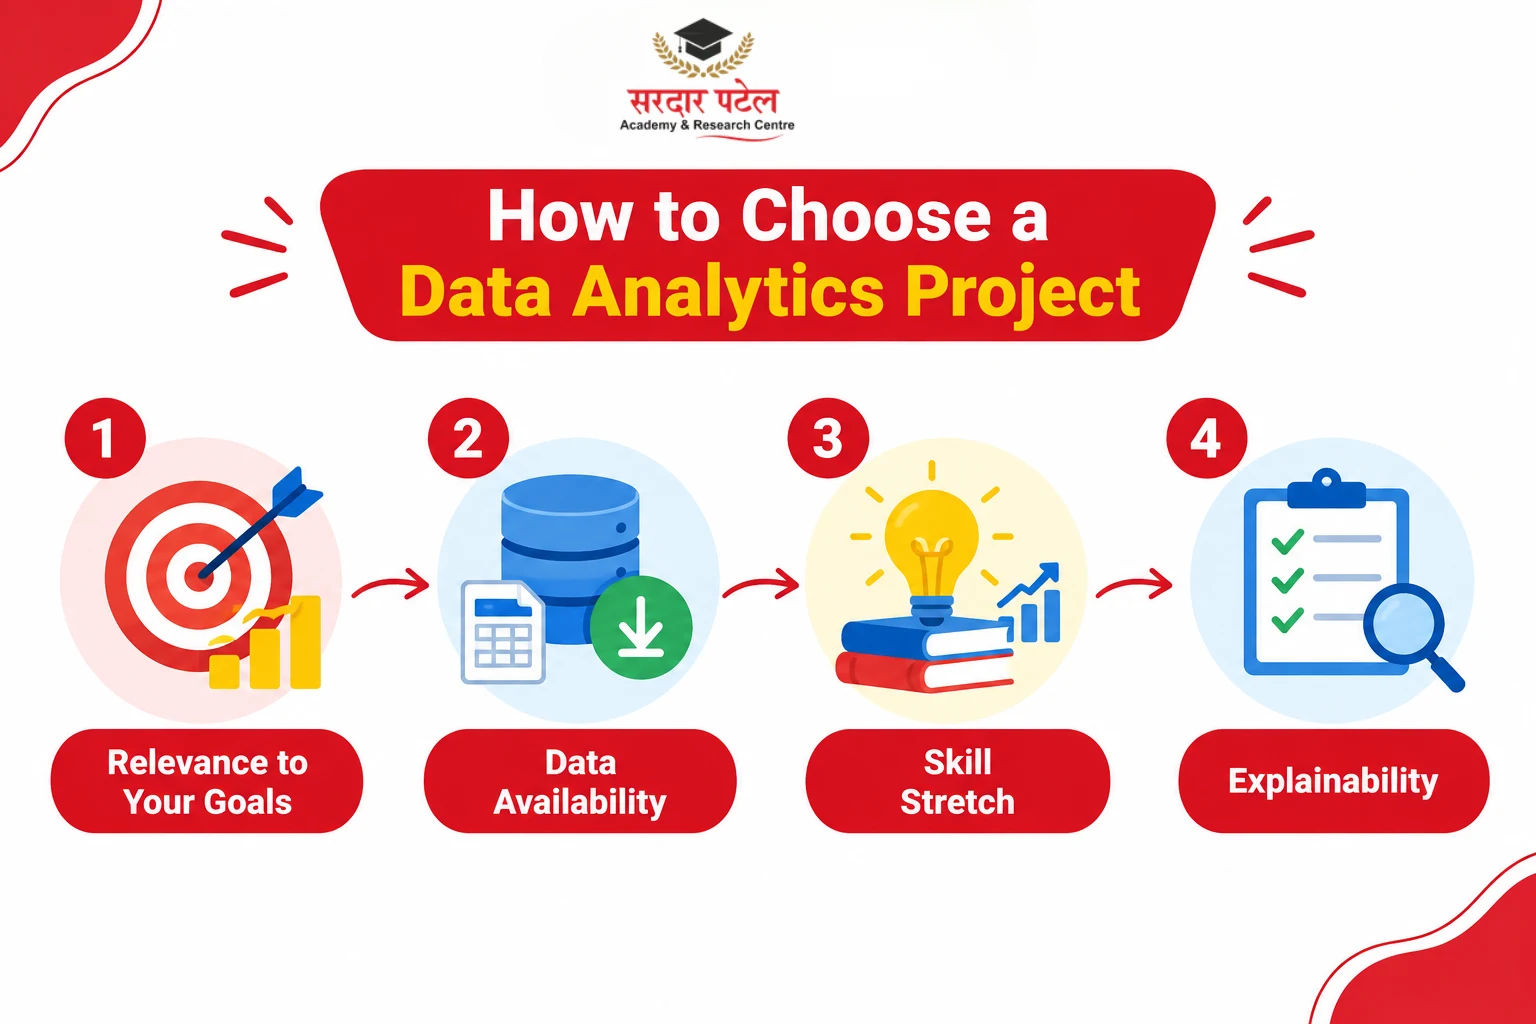
Before diving into specific project ideas, it helps to think about what makes a project worth your time:
- Relevance to your goals — If you're aiming for a business analyst role, pick projects with a business angle (sales, marketing, HR). If you're leaning toward technical roles, prioritize projects with more complex data cleaning or scripting.
- Data availability — Choose topics where you can realistically find or simulate a dataset.
- Skill stretch — Pick something slightly beyond your current comfort level so you're learning, not just repeating what you already know.
- Explainability — A good project is one you can walk someone through in five minutes, from question to insight. Understanding the data science process from problem definition to insights can also help you structure your project more effectively.
Thinking through these questions before you start will save you from abandoning a project halfway through, which is a common issue when picking a topic without a clear plan.
With that framework in mind, here are several beginner analytics project topics worth exploring.
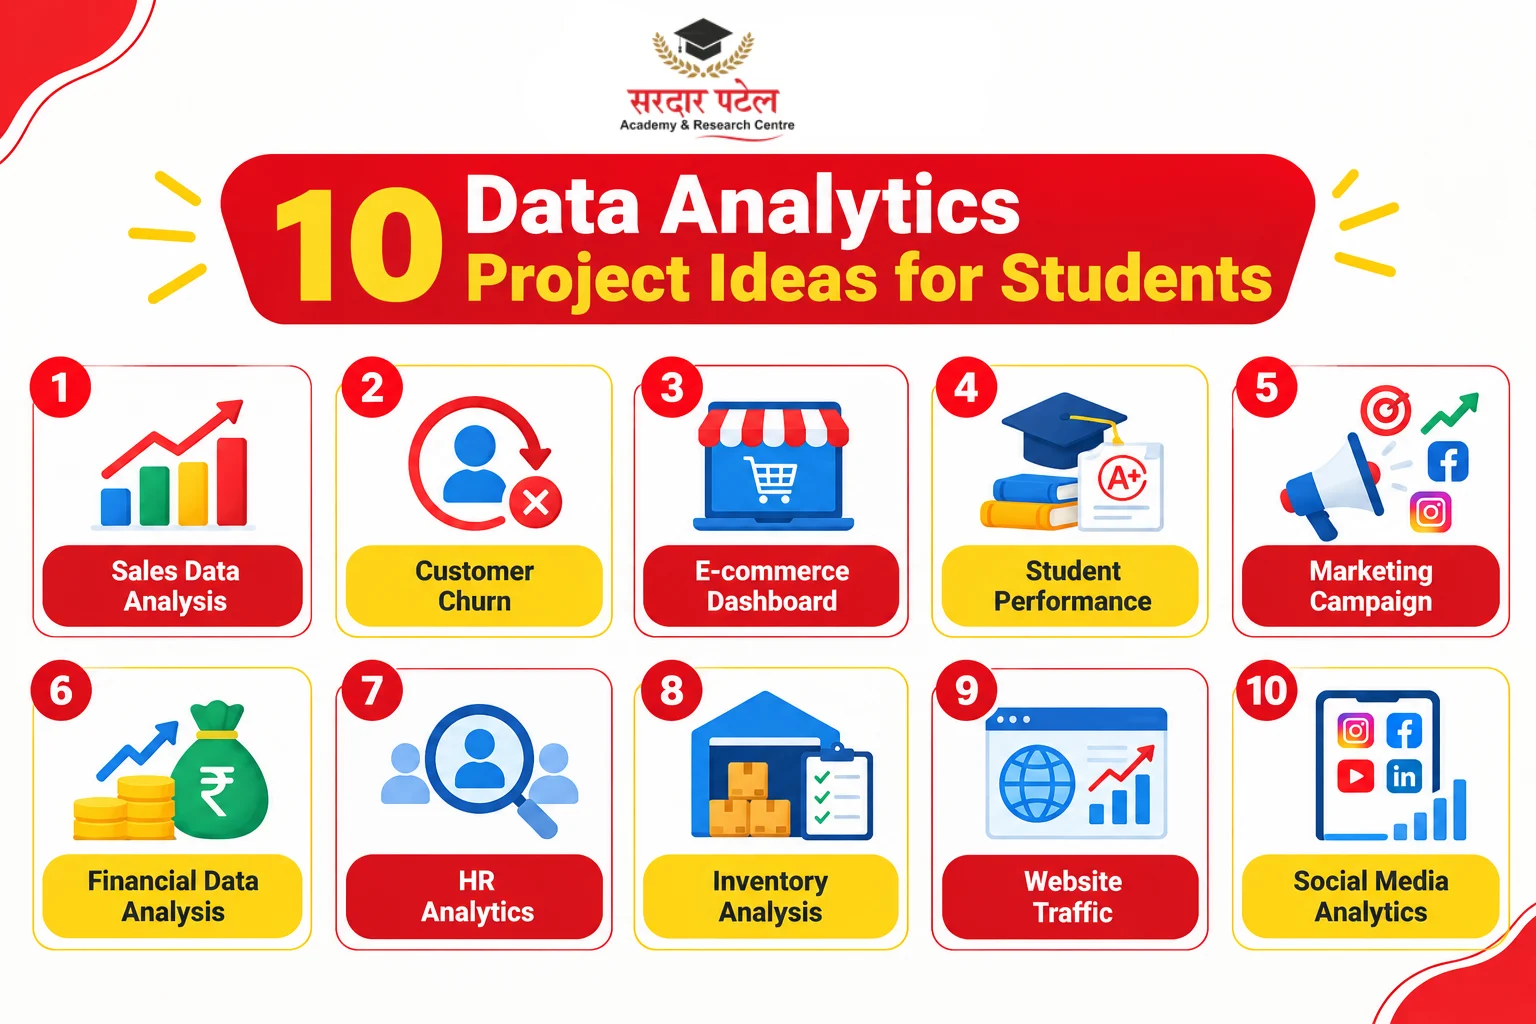
Best Data Analytics Project Ideas for Students
Sales Data Analysis Project
- Objective: Analyze historical sales data to identify trends, top-performing products, and seasonal patterns.
- Dataset/Data Source: Retail or e-commerce sales datasets (often available as sample datasets in spreadsheet or CSV format).
- Tools: Excel or Google Sheets for initial exploration, SQL for querying, and Power BI or Tableau for visualization. If you want to understand these tools in more detail, explore this data analytics tools guide before choosing the right stack for your project.
- Skills Learned: Data cleaning, aggregation, trend analysis, dashboard building.
- Portfolio Value: Demonstrates your ability to translate raw transactional data into business insight — one of the most common entry-level analytics tasks. Sales data is a great starting point because it's intuitive and widely available in sample form.
Customer Churn Analysis
- Objective: Identify which customers are likely to stop using a product or service, and why.
- Dataset/Data Source: Subscription or telecom churn datasets.
- Tools: Python (pandas for cleaning, matplotlib/seaborn for visualization), or Excel for a simpler version.
- Skills Learned: Feature exploration, correlation analysis, basic predictive thinking.
- Portfolio Value: Churn analysis is a genuinely high-value business problem, and a strong, resume-worthy pick for students entering the SaaS or subscription space.
E-commerce Dashboard
- Objective: Build an interactive dashboard summarizing orders, revenue, and customer behavior.
- Dataset/Data Source: Public e-commerce transaction datasets.
- Tools: Power BI or Tableau, with SQL for data preparation.
- Skills Learned: Data modeling, dashboard design, KPI selection.
- Portfolio Value: Dashboards are highly visual and easy to showcase in a portfolio or during interviews, which is why dashboard-building consistently ranks among the most requested projects for students.
Student Performance Analysis
- Objective: Explore how factors like study time, attendance, or extracurricular involvement relate to academic performance.
- Dataset/Data Source: Publicly available student performance datasets.
- Tools: Excel, Python, or SQL depending on your comfort level.
- Skills Learned: Descriptive statistics, correlation analysis, hypothesis framing.
- Portfolio Value: A relatable topic that's easy to explain to non-technical audiences — a useful trait when presenting any project in this list.
Marketing Campaign Analysis
- Objective: Evaluate the performance of different marketing campaigns based on metrics like click-through rate, conversion, and cost.
- Dataset/Data Source: Marketing campaign datasets or simulated ad-performance data.
- Tools: Excel for calculations, Power BI for visualization.
- Skills Learned: ROI calculation, comparative analysis, data storytelling.
- Portfolio Value: Shows you can connect data analysis directly to business decision-making — a quality that makes this one of the more career-relevant picks on this list.
Financial Data Analysis
- Objective: Analyze budgeting, expense, or investment data to identify spending patterns or trends.
- Dataset/Data Source: Personal finance datasets or simulated transaction records.
- Tools: Excel or Python with pandas.
- Skills Learned: Data categorization, trend visualization, basic forecasting.
- Portfolio Value: Financial analysis projects demonstrate attention to detail and numerical accuracy, qualities that make this a dependable pick for finance-curious students.
HR Analytics Project
- Objective: Examine employee data to understand attrition, satisfaction, or hiring trends.
- Dataset/Data Source: Public HR analytics datasets.
- Tools: SQL for querying, Power BI for visualization.
- Skills Learned: Data segmentation, comparative reporting, dashboard creation.
- Portfolio Value: HR analytics is a growing niche that few students explore — making it a distinctive way to stand out in a crowded portfolio.
Inventory Analysis
- Objective: Study stock levels, reorder patterns, and product movement to identify inefficiencies.
- Dataset/Data Source: Retail inventory datasets.
- Tools: Excel, SQL.
- Skills Learned: Data cleaning, pivot tables, basic inventory metrics.
- Portfolio Value: Shows practical, operations-focused analytical thinking, adding an operations angle useful for supply chain or retail-adjacent roles.
Website Traffic Analysis
- Objective: Analyze visitor behavior, traffic sources, and engagement patterns for a website.
- Dataset/Data Source: Sample web analytics datasets.
- Tools: Excel, Python, or Google Sheets.
- Skills Learned: Funnel analysis, segmentation, visualization.
- Portfolio Value: Connects analytics to digital marketing — a field many beginner project lists overlook, making it a smart addition to your portfolio.
Social Media Analytics Project
- Objective: Examine engagement metrics (likes, shares, comments) across posts to identify what content performs best.
- Dataset/Data Source: Public social media engagement datasets.
- Tools: Excel, Python for text/data cleaning.
- Skills Learned: Data aggregation, trend spotting, basic visualization.
- Portfolio Value: A relatable, visual project that's easy to present to any audience, and one of the simpler ideas to explain in a portfolio review.
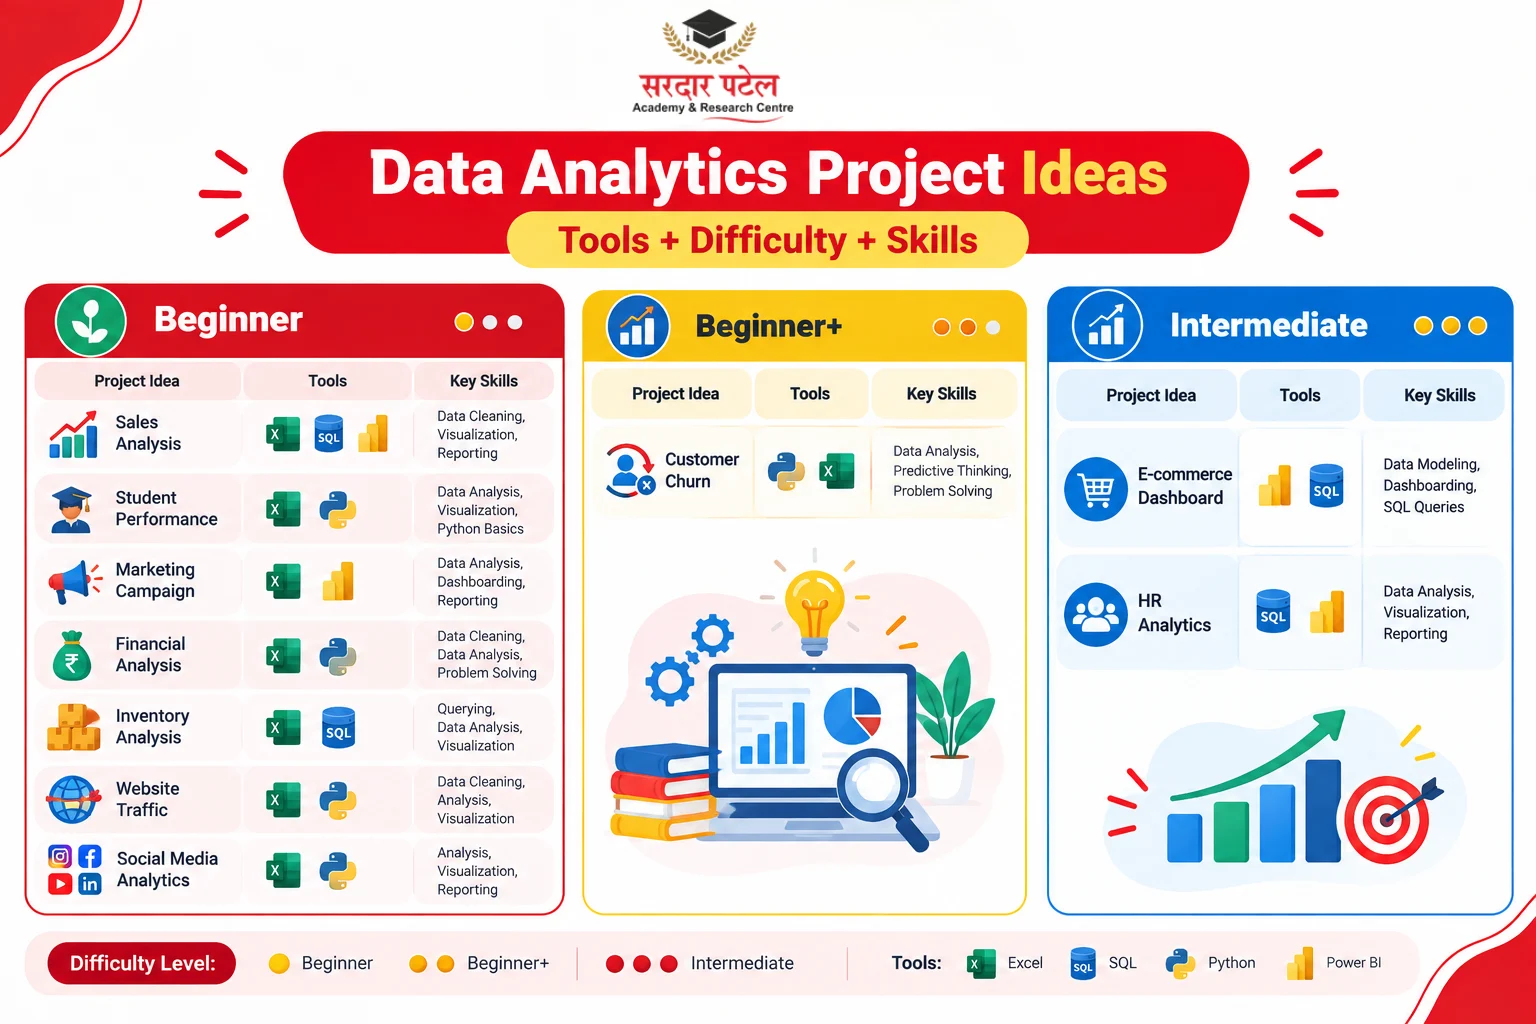
Quick Comparison Table
| Project Idea |
Tools |
Difficulty |
Key Skills |
| Sales Data Analysis |
Excel, SQL, Power BI |
Beginner |
Cleaning, trend analysis |
| Customer Churn Analysis |
Python, Excel |
Beginner+ |
Correlation, feature exploration |
| E-commerce Dashboard |
Power BI, SQL |
Intermediate |
Dashboard design, KPIs |
| Student Performance |
Excel, Python |
Beginner |
Descriptive statistics |
| Marketing Campaign |
Excel, Power BI |
Beginner |
ROI, storytelling |
| Financial Data Analysis |
Excel, Python |
Beginner |
Categorization, forecasting |
| HR Analytics |
SQL, Power BI |
Intermediate |
Segmentation, reporting |
| Inventory Analysis |
Excel, SQL |
Beginner |
Pivot tables, metrics |
| Website Traffic Analysis |
Excel, Python |
Beginner |
Funnel analysis |
| Social Media Analytics |
Excel, Python |
Beginner |
Aggregation, trend spotting |
Where to Find Data for These Projects
One of the biggest blockers for students starting any project like this isn't the analysis itself — it's finding a decent dataset to work with. A few reliable places to look:
- Open data repositories — platforms like Kaggle and the UCI Machine Learning Repository host thousands of free, ready-to-use datasets across sales, finance, HR, marketing, and more.
- Government open-data portals — many countries publish public datasets on employment, transport, health, and the economy, which work well for financial data analysis or student performance analysis projects.
- Built-in sample data — tools like Excel, Power BI, and Tableau ship with sample datasets specifically meant for practice, which is a low-friction way to start your first project.
- Company-published datasets — some companies release anonymized datasets for learning purposes, particularly around e-commerce and marketing analytics.
Whichever source you use, spend time understanding the columns and data types before jumping into analysis — this step alone will save hours of confusion later, and it's a skill every project on this list will test.
How These Projects Help Build a Portfolio
A strong portfolio isn't about having the most projects — it's about having a few well-explained ones. When choosing from this list, pick two or three that show range: one focused on cleaning and preparing messy data, one focused on visualization and dashboards, and one focused on drawing a clear business conclusion. If you're unsure how to build these skills step by step before starting your portfolio projects, follow this data analytics learning guide for a structured approach.
Document each project with a short write-up: what question you were answering, what data you used, what you found, and what tools you used to get there. This turns a simple exercise into a genuine demonstration of your analytical thinking — which is what separates a forgettable portfolio from one that gets noticed. If students are exploring structured analytics training alongside independent projects, parents' feedback about data analytics training can also provide useful perspective on the learning experience and practical support available.
Even a short, well-organized write-up for two or three projects can carry more weight in an interview than a long list of half-finished ones. These projects can also help students understand the skills expected in data analytics careers. 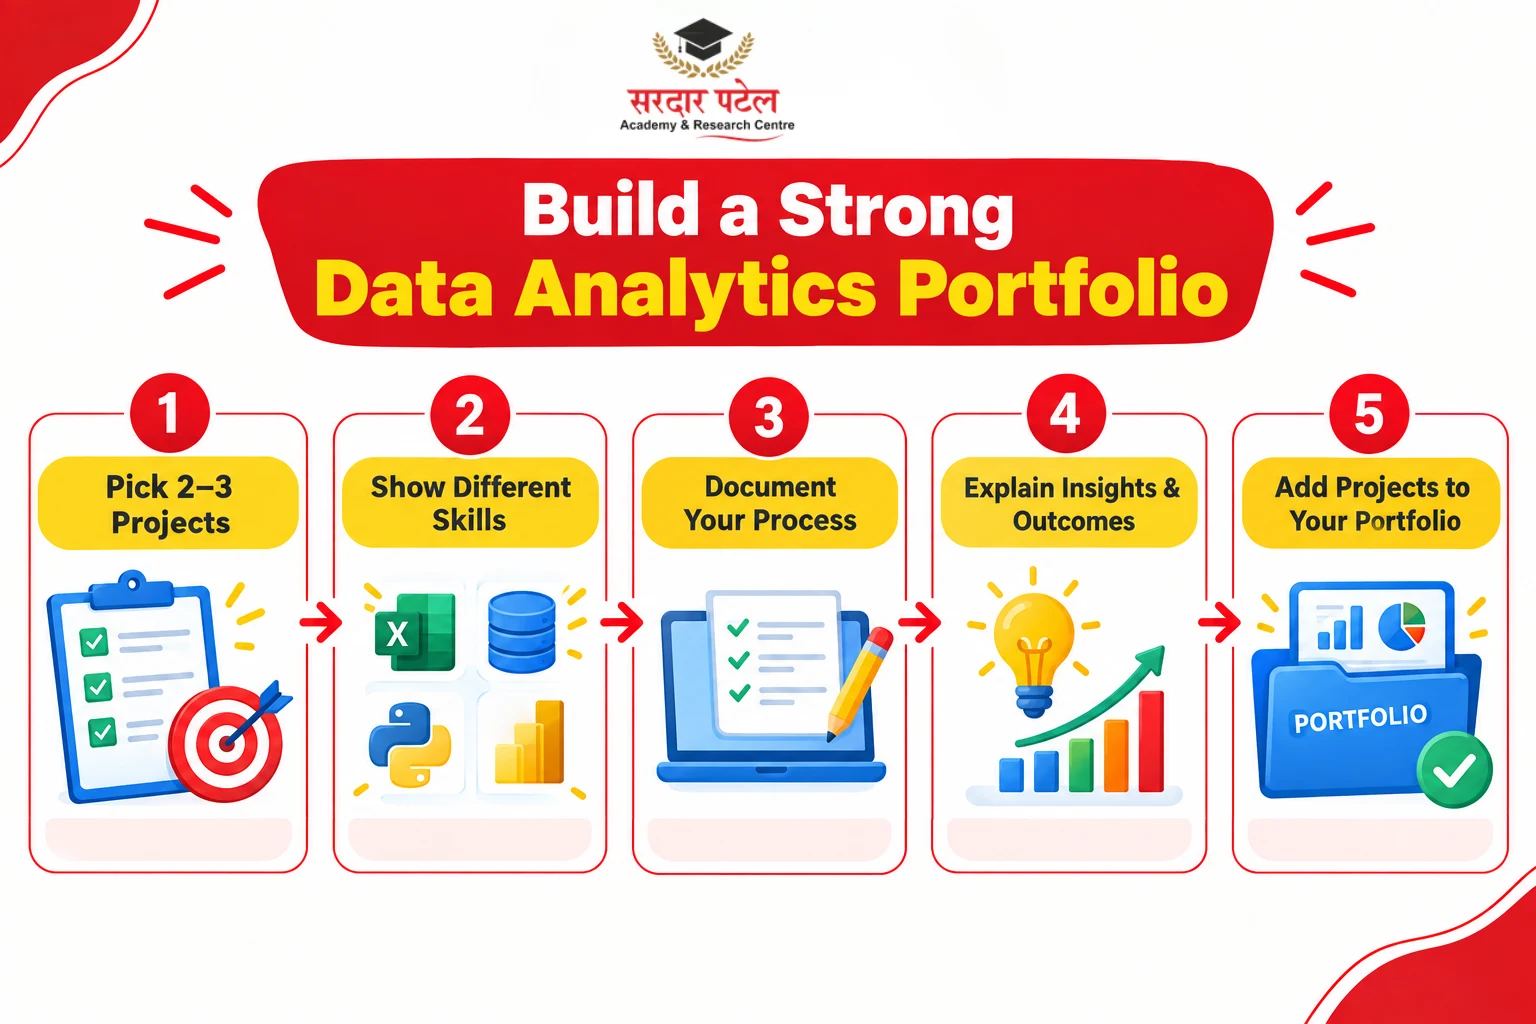
Common Mistakes Students Should Avoid
Even well-chosen project ideas can fall flat if students fall into a few avoidable traps.
- Picking a project just because it's popular, without understanding the underlying data or question.
- Skipping the data cleaning step and jumping straight to visualization — messy data leads to misleading conclusions.
- Overcomplicating tool choice by trying to use every tool at once instead of showing depth in one or two.
- Not explaining the "why" behind the analysis — a chart without context doesn't tell a story.
- Copying tutorials exactly instead of asking your own questions of the dataset.
Avoiding these mistakes will make your projects far more credible and interview-ready.
Tips for Presenting Analytics Projects
Once you've completed one or two projects from this list, how you present them matters almost as much as the work itself.
- Lead with the question, not the tool. Explain what you wanted to find out before describing how you found it.
- Keep visuals simple. One clear chart beats five cluttered ones.
- Summarize the insight in one sentence before diving into details.
- Host your work somewhere accessible — a GitHub repository, a portfolio site, or even a well-organized PDF.
- Be ready to explain your decisions, including why you chose a particular dataset or method.
For additional perspective on how analytics skills are evaluated and applied, an interview with analytics faculty can offer useful insights into project presentation and career preparation.
Conclusion
Working through even a handful of these data analytics project ideas will teach you more than passively consuming tutorials ever could. Start with one or two beginner analytics project topics that genuinely interest you, take the time to clean and understand the data, and document what you learn along the way. As your comfort grows, layer in more advanced tools and questions.
The most important step is simply to begin. Start Portfolio Building today by picking one project from this list and working through it from question to insight — that single project could be the one that gets your next opportunity noticed.
FAQs
Sales analysis, student performance analysis, and website traffic analysis are good starting points because the data is intuitive and widely available in sample form.
Excel-based projects like sales analysis, inventory analysis, or financial data analysis are accessible without any programming background. You can always layer in SQL or Python later once you're comfortable with the underlying logic of the analysis.
Excel and Google Sheets are good starting points, followed by SQL for querying and Power BI or Tableau for visualization. Python becomes useful as your projects grow more advanced, and together these tools cover most of the ideas featured in this guide.
List the project title, the tools used, and a one-line summary of the insight or outcome — ideally with a link to the full write-up or dashboard. This is one of the simplest ways to turn a project into resume-ready proof of skill.
Each project adds a concrete example of your analytical process, giving recruiters something specific to discuss rather than just a list of skills. Over time, a small set of well-documented projects becomes far more persuasive than a long, thin list of certificates.