+91 9312966129
 sparc.enquiry01@gmail.com


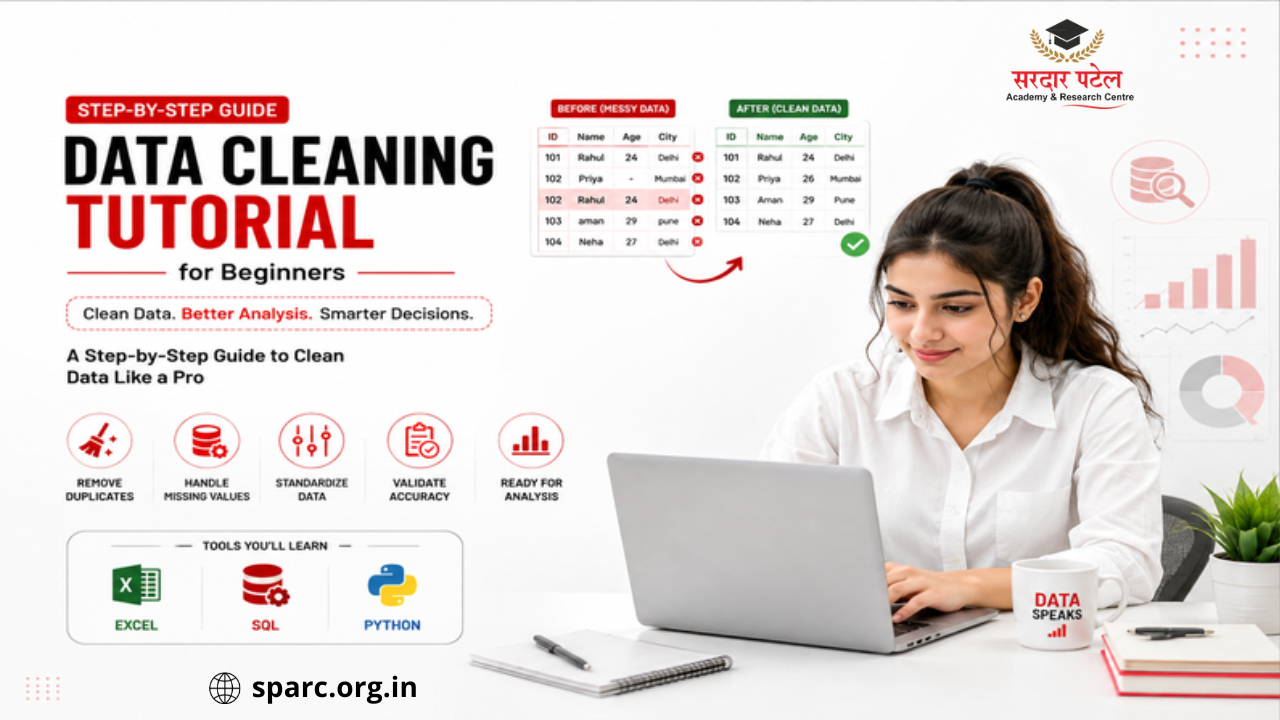
Data Cleaning Tutorial for Beginners
Learn data cleaning step by step with real Excel formulas, SQL queries, and Python code. A beginner-friendly guide to prepare accurate data for analysis.
https://www.sparc.org.in/blog/python-pandas-tutorial
Table of Contents
- What Is Data Cleaning?
- Why Data Cleaning Matters
- Common Data Problems Every Beginner Should Know
- 1. Missing Values
- 2. Duplicate Records
- 3. Inconsistent Date Formats
- 4. Typographical Errors
- 5. Outliers
- 6. Inconsistent Categories
- Data Cleaning vs. Data Preprocessing
- The Step-by-Step Data Cleaning Process
- Step 1: Understand Your Dataset
- Step 2: Identify Missing Data
- Step 3: Remove Duplicate Records
- Step 4: Standardise Formatting
- Step 5: Handle Missing Values the Right Way
- Step 6: Correct Inconsistent Categories
- Step 7: Detect and Investigate Outliers
- Step 8: Validate the Cleaned Dataset
- Data Cleaning in Excel
- Data Cleaning in SQL
- Data Cleaning in Python (Pandas)
- Practical Example: Cleaning a Sales Dataset
- Raw data:
- Cleaned data:
- Best Practices
- Common Mistakes Beginners Should Avoid
- Quick Recap
- Conclusion
Imagine spending hours building charts and dashboards, only to discover your results are wrong because the underlying data was messy. This happens constantly in the real world — many analysts report spending the majority of their working time cleaning and preparing data before any actual analysis begins.
If you're new to this field, first understand What is Data Analytics? before learning how data cleaning fits into the analytics workflow.
| Consistency note (not part of original text): Excel aur Pillar articles mein ye claim ek specific number (commonly cited: analysts spend roughly 60-80% of their time on data cleaning and preparation) ke saath likha gaya hai. |
That's why mastering this process is one of the most valuable skills anyone entering data analytics can build. Whether you're working in Excel, SQL, or Python, clean data is the foundation on which everything else depends. No dashboard, model, or report can be trusted if the data behind it is full of errors, duplicates, or missing values.
This guide walks through the entire workflow in plain language, with real examples and actual code — not just theory — so you can apply it immediately to your own datasets.
If you're planning a career in data analytics, practising these techniques through structured, hands-on training — such as the programs at SPARC (Sardar Patel Academy & Research Centre) — can help you build job-ready skills faster.
What Is Data Cleaning?
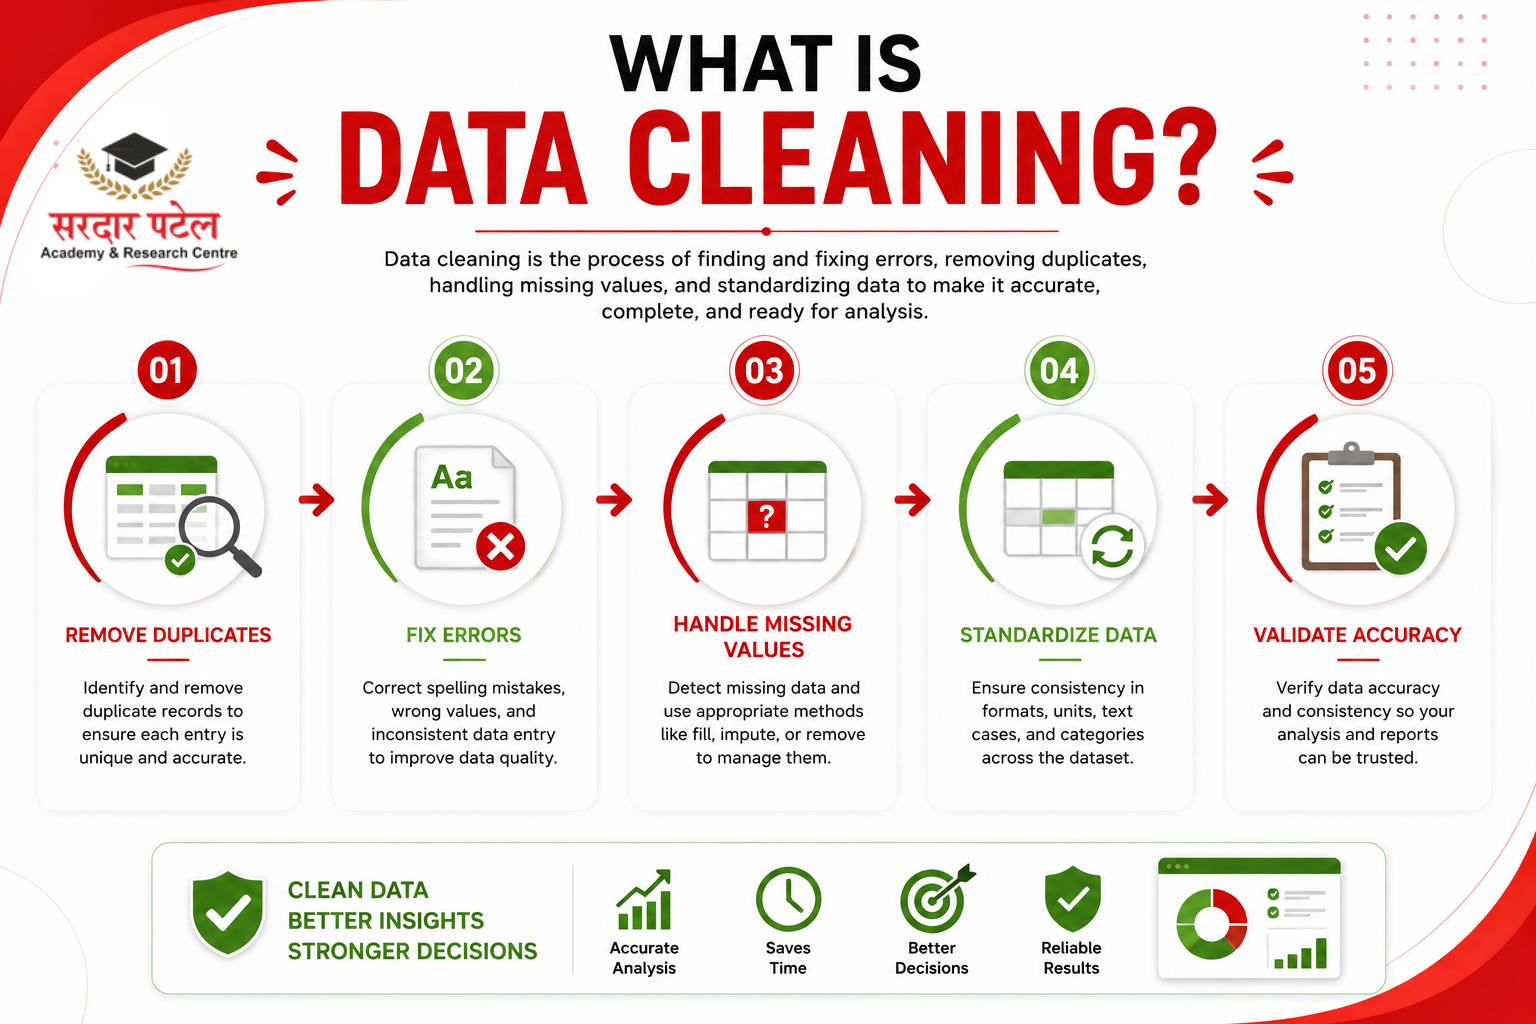
Data cleaning is the process of identifying and correcting errors, removing duplicate records, resolving inconsistencies, and handling missing values so that a dataset becomes accurate, complete, and ready for analysis. Data cleaning is performed using several popular tools. Explore the Top Data Analytics Tools every beginner should learn.
Think of it like tidying a room before guests arrive. You could own expensive furniture, but if everything is scattered, the room still looks bad. Data cleaning follows well-established practices used across the data industry. You can also explore Microsoft's guide on data cleaning best practices.
The same applies to data — even great analysis tools can't save a messy dataset.
Data cleaning typically includes:
- Removing duplicate records
- Fixing spelling and formatting mistakes
- Handling missing values
- Standardising categories and units
- Removing irrelevant information
- Validating accuracy before analysis
Skip these steps, and your reports risk producing conclusions that are confidently wrong.
Why Data Cleaning Matters
Many beginners jump straight to visualisation or machine learning. Experienced analysts know better — clean data always comes first.
- Better decisions. Businesses act on what the data tells them. Bad inputs lead to bad strategy.
- Higher accuracy. Clean datasets reduce calculation and reporting errors.
- Faster analysis. Organised data is simply easier and quicker to work with.
- Stronger models. Machine learning algorithms perform significantly better on clean training data.
- Better use of time. Instead of firefighting errors mid-project, analysts can focus on actual insight generation.
Common Data Problems Every Beginner Should Know
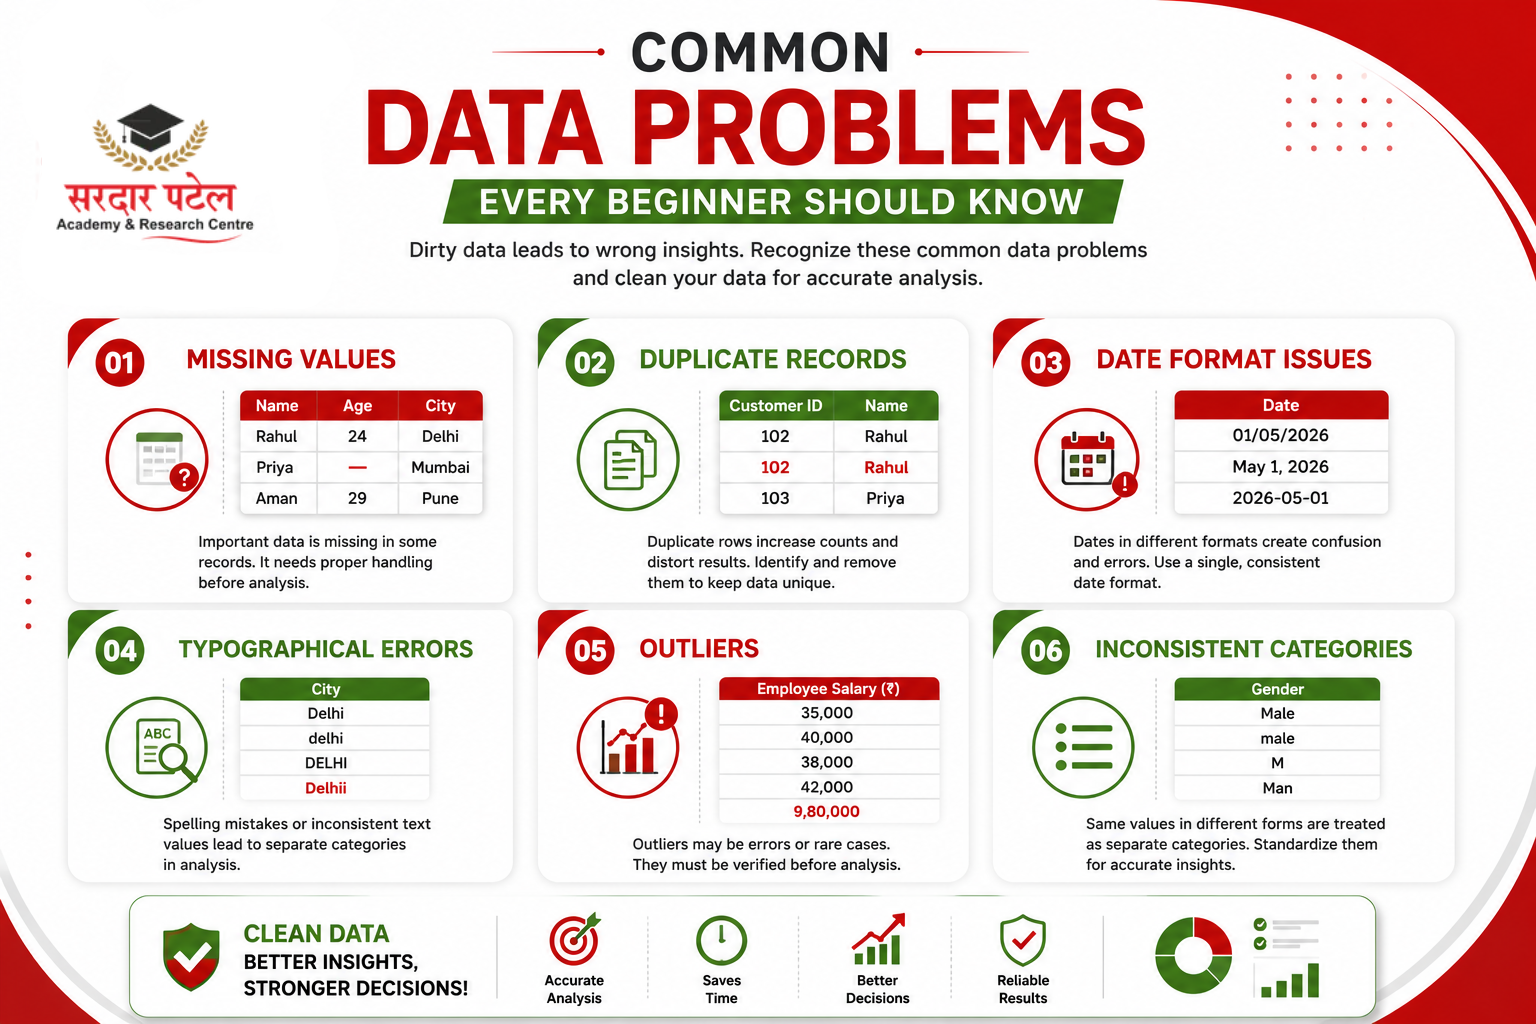
1. Missing Values
Priya's age is missing — a common issue that needs a deliberate decision, not an automatic fix.
2. Duplicate Records
This row is repeated and will inflate totals if not addressed.
3. Inconsistent Date Formats
The same date written three different ways: 01/05/2026, May 1, 2026, 2026-05-01. All dates in a dataset should follow a single format.
4. Typographical Errors
Delhi, delhi, DELHI, Delhii — four different text strings representing one city. Left uncorrected, these split into separate groups during analysis. Related Read: Best Free Tools for Data Analytics
5. Outliers
The last value needs verification — it could be a data entry error, a different employee category (e.g., a director-level role), or a genuine value.
6. Inconsistent Categories
Male, male, M, and Man all represent the same category but will be treated as four separate values unless standardised.
Data Cleaning vs. Data Preprocessing
These terms are related but not identical.
Data cleaning focuses specifically on correcting errors — duplicates, missing values, formatting, inconsistency.
Data preprocessing is the broader umbrella: cleaning plus transforming data into a format suitable for analysis or machine learning. It generally includes:
- Data cleaning
- Data integration
- Data transformation
- Data reduction
- Feature engineering
Think of preprocessing as the full preparation pipeline, with cleaning as one critical stage inside it.
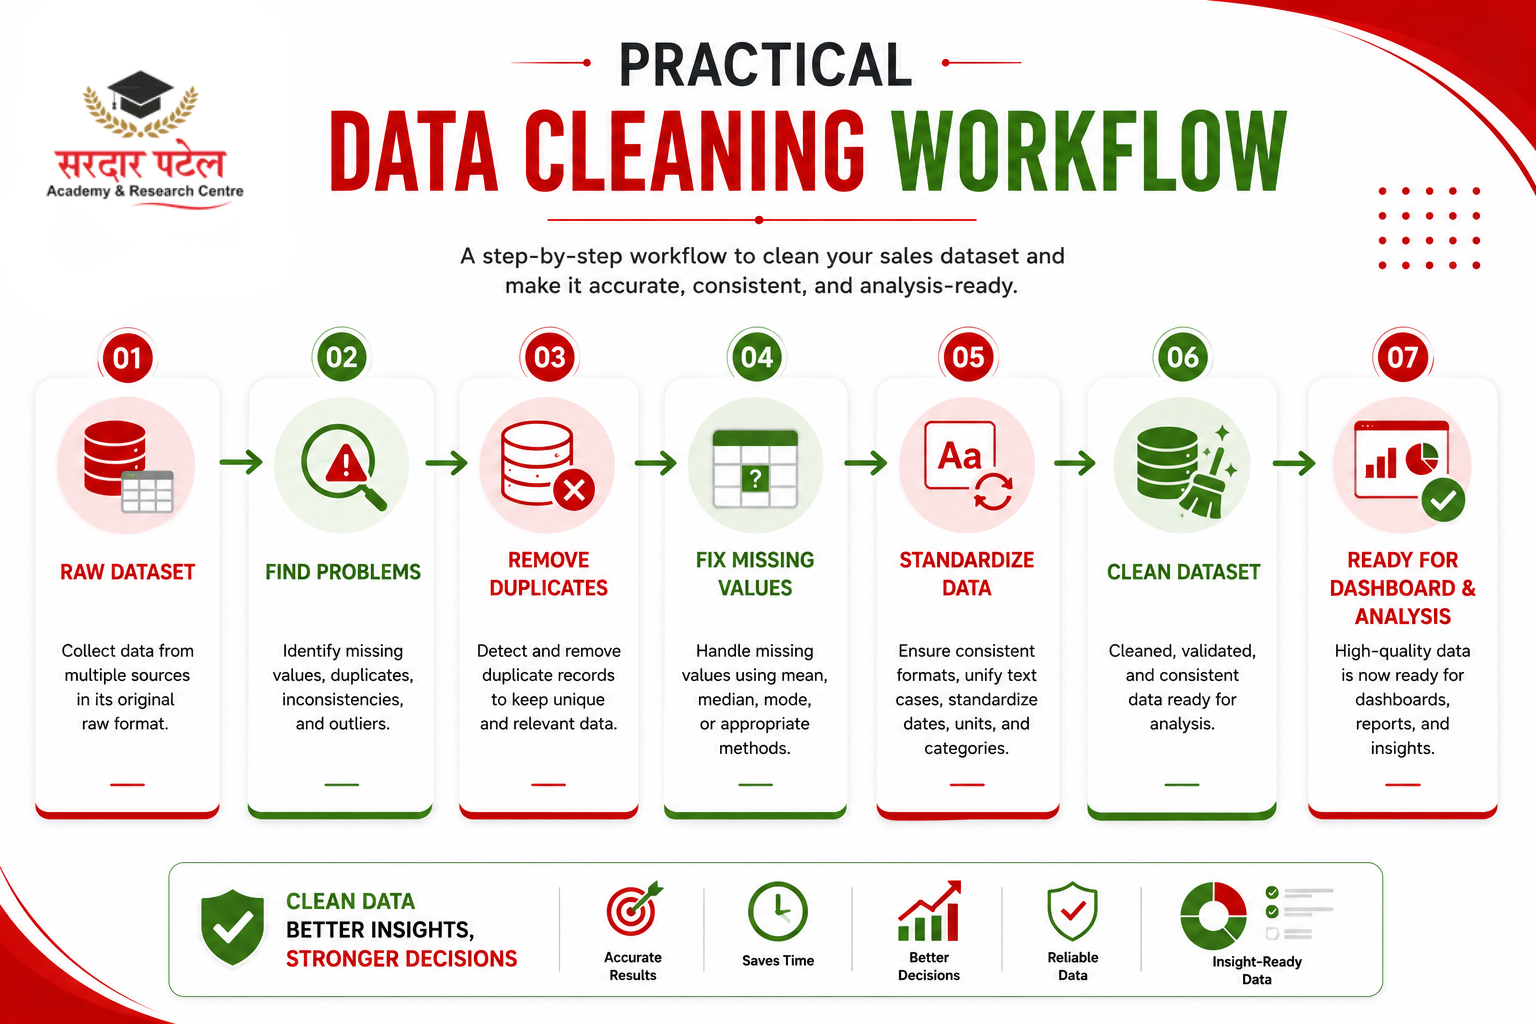
The Step-by-Step Data Cleaning Process
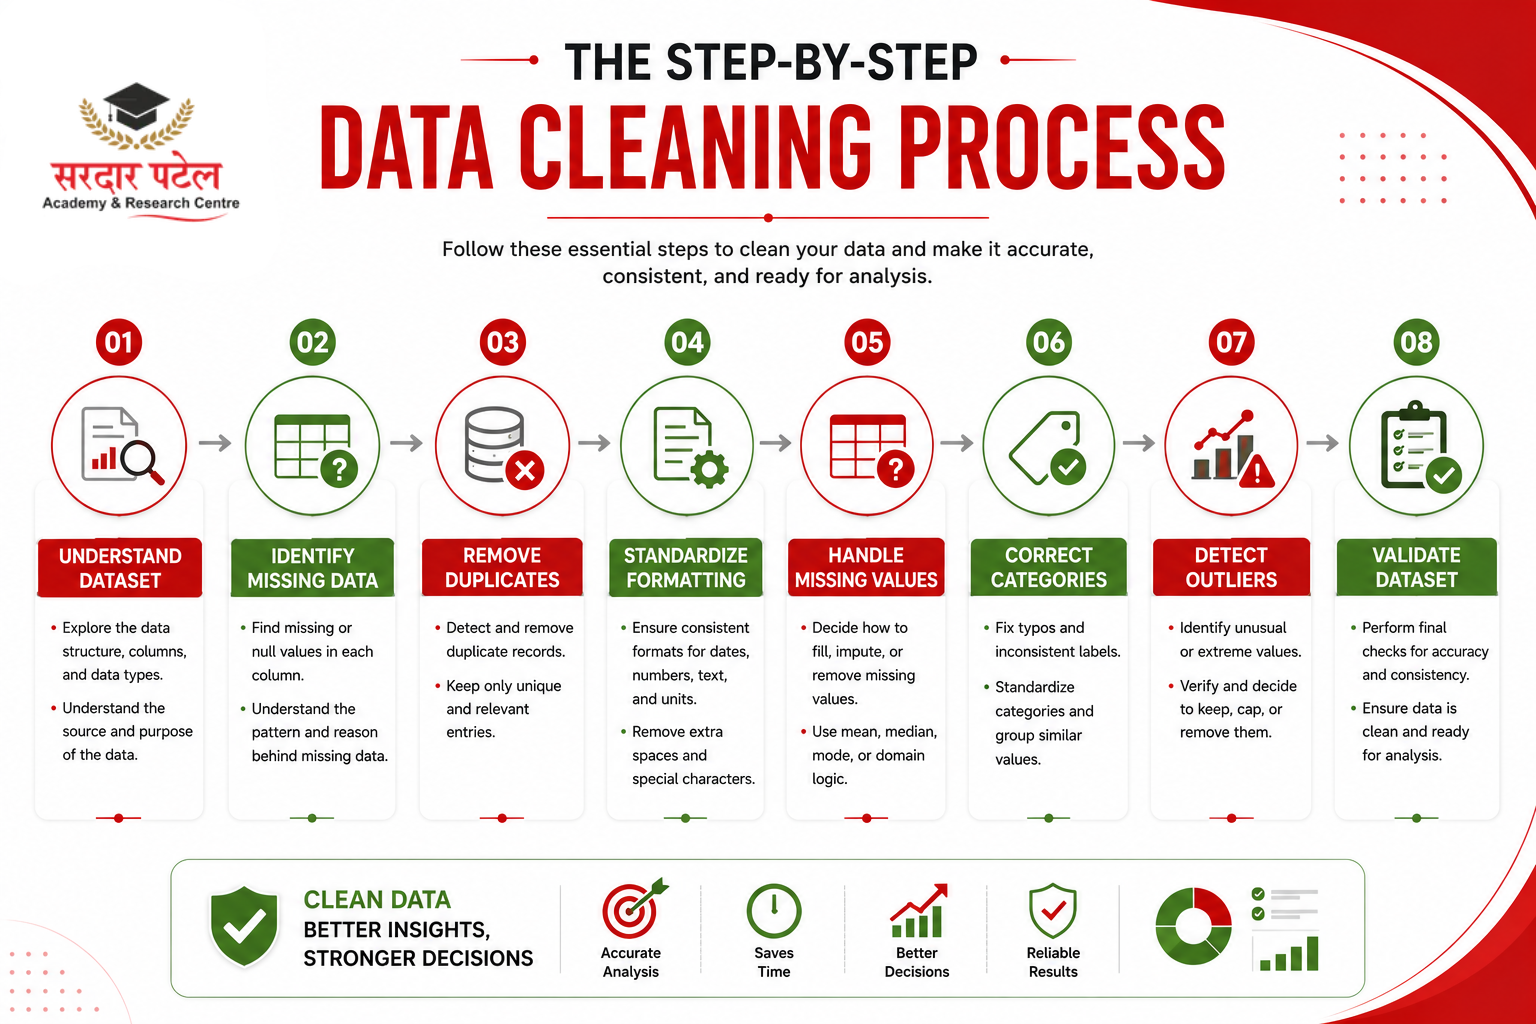
Step 1: Understand Your Dataset
Before touching anything, answer: What does each column represent? How many rows exist? Which fields are mandatory? Which are numeric vs. text? Skipping this step is how beginners accidentally delete valid data.
Step 2: Identify Missing Data
For each column, ask: Which values are missing? Are they important? Can they be reasonably filled, or should the row be removed?
One missing value out of three columns might be filled using business records. If 40% of a column is missing, a different strategy — or excluding the column — may be needed.
Step 3: Remove Duplicate Records
Duplicates usually come from repeated imports, manual entry mistakes, or system sync errors. Always verify before deleting — sometimes a "duplicate" is actually two separate, valid transactions.
Step 4: Standardise Formatting
Make sure dates, currency symbols, capitalisation, phone numbers, and country names all follow one convention. Example: USA, U.S.A, United States → standardise to United States.
Step 5: Handle Missing Values the Right Way
- Option 1 — Remove the row. Best when very few values are missing, and the row isn't critical to the analysis.
- Option 2 — Fill in the value. Common methods: mean, median, mode, or a business-defined default. Example: ages 22, 24, 25, 23, 24 → fill the missing value with 24 (the median).
- Option 3 — Leave it blank intentionally. Sometimes a blank is meaningful — e.g., a customer who has never purchased anything shouldn't get a fabricated "last purchase date."
Step 6: Correct Inconsistent Categories
Consistency directly improves filtering, grouping, and pivot accuracy.
Step 7: Detect and Investigate Outliers
Common detection methods: Box plots, Scatter plots, Interquartile Range (IQR), Z-score method. Practice data cleaning on real-world datasets available on Kaggle Datasets.
Never delete an outlier purely because it looks unusual — verify whether it's an error, a different category, or a genuine extreme value first.
Step 8: Validate the Cleaned Dataset
Before calling the job done, confirm: all required columns are filled, dates are in one consistent format, numbers are stored as numbers not text, duplicates are gone, category labels are consistent, and totals/sums make logical sense.
Data Cleaning in Excel
Excel remains popular for beginners because it's accessible and widely used in business settings.If you're new to Excel formulas, Microsoft's documentation explains how the TRIM function removes unnecessary spaces.
Key features and what they do:
- Remove Duplicates (Data tab) — flags and deletes repeated rows based on selected columns
- TRIM() — strips extra leading/trailing/internal spaces: =TRIM(A2)
- CLEAN() — removes non-printable characters from imported data
- Find & Replace (Ctrl+H) — bulk-fixes spelling/formatting inconsistencies
- Text to Columns — splits combined data (e.g., "Rahul, Delhi") into separate fields
- Flash Fill (Ctrl+E) — auto-detects a pattern and fills the rest of a column
- IFERROR() — catches calculation errors: =IFERROR(A2/B2, "N/A")
- Data Validation — restricts entries to a defined list, preventing future inconsistency
- Conditional Formatting — visually highlights duplicates, blanks, or outliers for quick review
Example:
Before: " Rahul Sharma "
Formula: =TRIM(A2)
After: Rahul Sharma
One formula, applied across a column, can fix thousands of rows in seconds.
Data Cleaning in SQL
SQL is the standard tool when working with large databases that don't fit comfortably in Excel. To understand how the UPDATE statement works in different databases, refer to the official SQL documentation.
Find duplicate emails in a customer table:
sql
SELECT email, COUNT(*) AS total
FROM customers
GROUP BY email
HAVING COUNT(*) > 1;
Remove duplicates, keeping only the lowest customer_id per email:
sql
DELETE FROM customers
WHERE customer_id NOT IN (
SELECT MIN(customer_id)
FROM customers
GROUP BY email
);
Replace NULL values with a default:
sql
UPDATE customers
SET city = 'Unknown'
WHERE city IS NULL;
Standardise text casing:
sql
UPDATE customers
SET city = INITCAP(TRIM(city));
Filter out invalid rows before analysis:
sql
SELECT *
FROM orders
WHERE order_amount > 0
AND order_date IS NOT NULL;
SQL is especially efficient for cleaning at scale — you fix the data once, directly in the database, instead of repeating manual steps every time you export to Excel.
Data Cleaning in Python (Pandas)
Python's Pandas library is the go-to tool for automating cleaning on large or repetitive datasets. As automation grows, AI-powered data cleaning is becoming increasingly common. Learn more about The Rise of AI in Data Analytics.
Check for missing values:
python
import pandas as pd
df = pd.read_csv("sales_data.csv")
print(df.isnull().sum())
Remove duplicate rows:
python
df = df.drop_duplicates()
Fill missing values with the column median:
python
df['price'] = df['price'].fillna(df['price'].median())
Standardise text columns:
python
df['city'] = df['city'].str.strip().str.title()
Convert a column to the correct date format:
python
df['order_date'] = pd.to_datetime(df['order_date'], errors='coerce')
Detect outliers using the IQR method:
python
Q1 = df['salary'].quantile(0.25)
Q3 = df['salary'].quantile(0.75)
IQR = Q3 - Q1
outliers = df[(df['salary'] < Q1 - 1.5*IQR) | (df['salary'] > Q3 + 1.5*IQR)]
print(outliers)
Even five or six lines of Pandas code can do in seconds what would take an hour of manual Excel work — and the same script can be reused on every new dataset. The official Pandas documentation provides detailed explanations and additional examples for every data-cleaning function used in this guide.
Related Read: Python Pandas Tutorial
Practical Example: Cleaning a Sales Dataset
Raw data:
Problems identified
- Duplicate record (Rahul appears twice)
- Inconsistent city spelling ("delhi" vs. "Delhi")
- Missing sales value (Aman)
Cleaned data:
*Filled using the average of comparable Mumbai transactions, based on business judgment — not a guess.
The dataset is now ready for dashboarding or further analysis.
Related Read: Data Visualisation Basics
Best Practices
- Always keep a backup of the original, unmodified dataset
- Understand the business context before changing or deleting anything
- Document every cleaning step taken (for reproducibility)
- Standardise naming conventions across all columns
- Validate the result after cleaning — don't assume it worked
- Automate repetitive cleaning tasks with SQL or Python scripts
- Investigate unusual values before removing them
- Maintain consistency across every column, not just the obvious ones
Common Mistakes Beginners Should Avoid
- Deleting data too quickly — investigate before removing anything
- Ignoring duplicates — they silently inflate totals and skew averages
- Mixing date formats — 01/05/2026 and May 1, 2026 in the same column breaks sorting and filtering
- Skipping validation — cleaning without a final check can leave hidden errors
- Not backing up the original — always keep a restorable copy
- Assuming every outlier is an error — some represent real, important business events
Quick Recap
- Understand your dataset.
- Identify missing values
- Remove duplicate records
- Standardise formatting
- Handle missing data appropriately
- Correct inconsistent categories
- Detect and verify outliers
- Validate the final dataset
Conclusion
Every reliable analytics project starts with clean, trustworthy data. Whether you're working in Excel, writing SQL queries, or building Pandas pipelines, your results are only as good as the data feeding them. If you want to master Excel, SQL, Python, and data visualisation, follow this Step-by-Step Data Analytics Learning Guide. Data cleaning isn't a beginner's chore — it's a professional habit every analyst keeps for their entire career.
Start small, practice on real datasets, and gradually combine Excel, SQL, and Python as your comfort grows. Over time, spotting and fixing data quality issues becomes second nature. Ready to build job-ready skills? Explore our complete guide on Data Analytics Course & Career Opportunities and start your journey.
Build this skill hands-on at SPARC (Sardar Patel Academy & Research Centre) through real-world projects covering Excel, SQL, and Python-based data cleaning, data validation techniques, and practical business case studies — designed to take you from beginner to job-ready data analyst.
Enrol Now: Explore SPARC's Data Analytics Course →
FAQs
It's the process of identifying and fixing errors in a dataset — removing duplicates, correcting formatting, and handling missing values — so the data is accurate and ready for analysis.
NULL means the value is unknown or doesn't exist at the database level. A blank (empty string '') is an actual stored value that happens to be empty. They behave differently in filters — WHERE city IS NULL won't match WHERE city = ''. Mixing the two without realizing it is a common source of cleaning bugs.
No. The average (mean) is sensitive to outliers and is only appropriate for fairly symmetric numeric data. For skewed data, the median is usually safer. For categorical data, use mode or a business-defined default — never a numeric average.
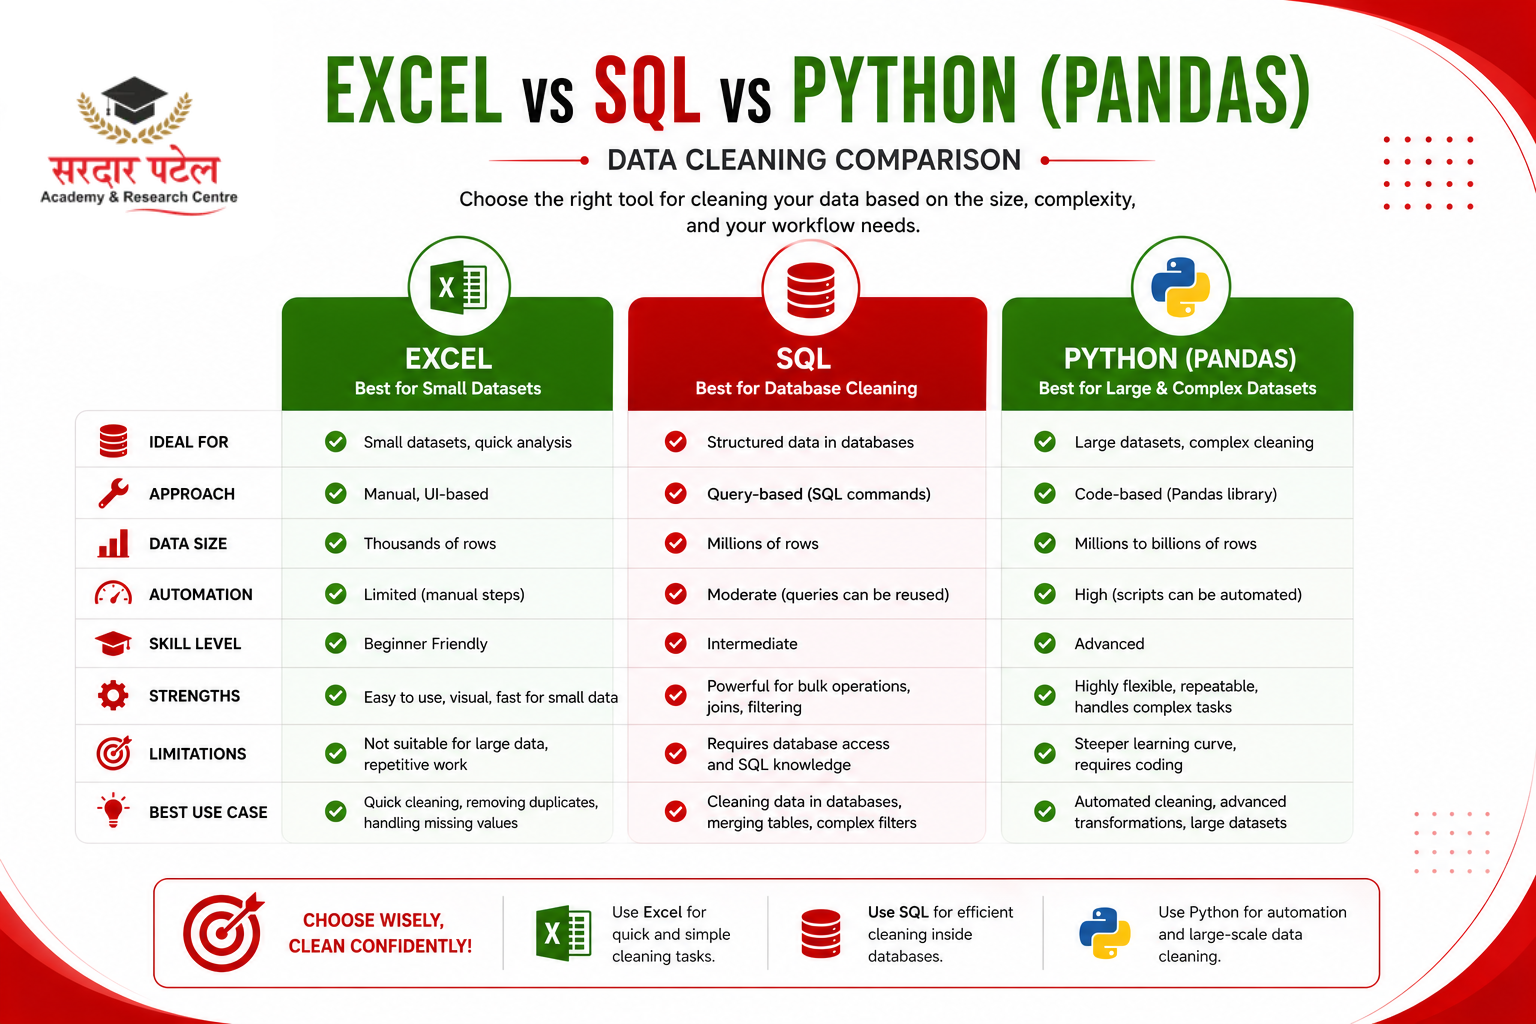
Start with Excel for intuition and small datasets, move to SQL once you're working with structured databases, and add Python/Pandas when you need to automate repetitive cleaning across many files. Most working analysts use a mix of all three.
Cross-check it against the source — a different system, a manual log, or a colleague familiar with that data. Never delete an outlier solely because it looks statistically unusual; verify its origin first.
Most beginners grasp the fundamentals within a few weeks of regular practice. Becoming fluent in Excel, SQL, and Python typically takes a few months of hands-on work with real, messy datasets.