+91 9312966129
 sparc.enquiry01@gmail.com



Power BI Copilot in 2026: Features, Uses and Limitations
Power BI Copilot in 2026: what it can do, what it needs to run, where it falls short, and what beginners should learn first before using it well.

Open Power BI today and a Copilot button is often the first thing you notice. It began as a small assistant in the report pane. In 2026 it grew into a chat experience across reports, apps, mobile and Microsoft 365.
Fair questions follow. What can it really do? What does it take to switch on? And if you are learning analytics at Sardar Patel Academy & Research Centre (SPARC), do you still need the manual skills? This guide answers all three plainly.
What Is Power BI Copilot?
Power BI Copilot is an AI assistant built into Power BI. It helps people analyse data, build reports and pull out insights. You type a question or instruction in everyday language, and it replies with insights, visuals, summaries or formulas. Microsoft positions it for report users who explore data and for creators who build pages and write DAX.
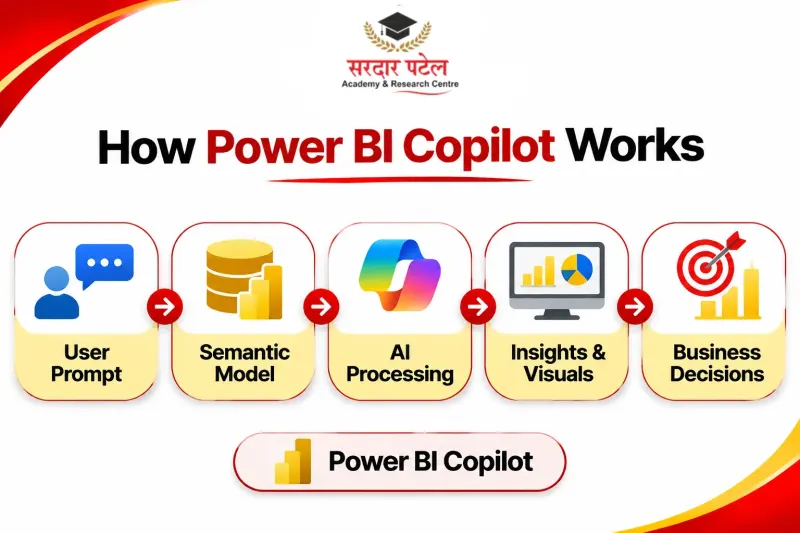
It works from your semantic model: the tables, relationships and measures behind a report. So a tidy model gives sharper answers, and a messy one gives confusing ones.If you want to understand how reports and visuals are built step by step, explore our Power BI Dashboard Tutorial.
How It Differs from Older Power BI AI Features
Power BI has long offered smart features such as Key Influencers, Decomposition Tree and the Q&A visual. Each of those Power BI AI features does one specific job. Copilot is broader: you can ask for a follow-up, change direction halfway, and go from "summarise this page" to "write a year-over-year growth measure" in one conversation.
This style of working is often grouped under augmented analytics, if you want the wider idea behind it.
Copilot Updates Through 2026
Microsoft ships Power BI changes every month, and Power BI Copilot features in most releases. Each row links to Microsoft's own summary.
| Month |
What changed |
Source |
| Feb 2026 |
Prompt limit raised from 500 to 10,000 characters in all Copilot surfaces; a more conversational Copilot in Power BI apps, with app summaries |
February summary |
| Mar 2026 |
Copilot pane in reports and apps refreshed to match the standalone look; the feedback dialog can now include diagnostics |
March summary |
| Apr 2026 |
In-report Copilot on Power BI mobile gained full back-and-forth chat; Microsoft's separate announcement labelled it preview |
April summary |
| May 2026 |
Summarize shortcuts on the report ribbon and visual header; Copilot narrative visual embedding in customer applications (preview) |
May summary |
| Sep 2026 |
Agentic experiences and Power BI data answers in Microsoft Copilot Chat reached general availability; Microsoft 365 Copilot in Power BI and a remote authoring MCP server arrived in preview |
September summary |
| Oct 2026 |
The Power BI Report Authoring skill, part of Skills for Fabric, now supports custom visuals (general availability): it can bind data, apply formatting and validate the result from plain-language requests |
October summary |
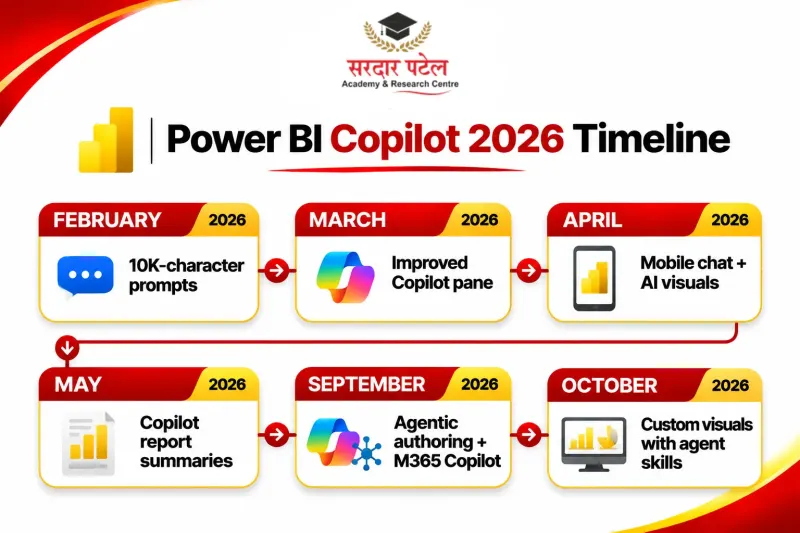
Some items remain in preview. When Microsoft last updated its Copilot overview in August 2026, the report pane was generally available, while the standalone Copilot and Copilot in apps were still in preview. Check the notes before building a workflow around a new feature.For the latest information on supported experiences, features and requirements, refer to Microsoft's official Power BI Copilot documentation.
What Copilot Can Do in Practice
Answer questions about your data
Instead of building a chart first, type "which region had the weakest sales last quarter?" Copilot uses information from the data model to provide relevant answers. This is natural language querying in action, explained in our guide to natural language querying in data analytics. Longer prompts help, since you can paste in business context rather than squeezing it into one line.
Build a report page from a prompt
Power BI Copilot uses your instructions to recommend relevant charts and organize the report page. It can save time on a first draft, which you then polish by hand. For a practical walkthrough of generating and editing report pages, follow Microsoft's guide to creating and editing Power BI reports with Copilot.
Write and explain DAX
DAX is where many beginners stall. Power BI Copilot can draft a measure from a plain description and explain an existing one in simple words. Review the formula before you apply it: read it, test it, then keep it. Apart from Copilot, several other AI solutions can simplify everyday analytics tasks. Read our guide to AI Tools Every Data Analyst Should Know to explore more options.
Summarise for busy readers
Narrative summaries turn a page into a short written explanation, which suits managers who skip tabs. Since May 2026, a Summarize button on the report ribbon and visual header makes that a single click.
Where Teams Use It
| Situation |
How Copilot helps |
What you still check |
| Weekly sales review |
Summarises the page and points to movement |
Whether the summary matches the numbers on screen |
| New profit margin measure |
Drafts the DAX from a description |
Filter context, blanks and totals |
What You Need Before It Works
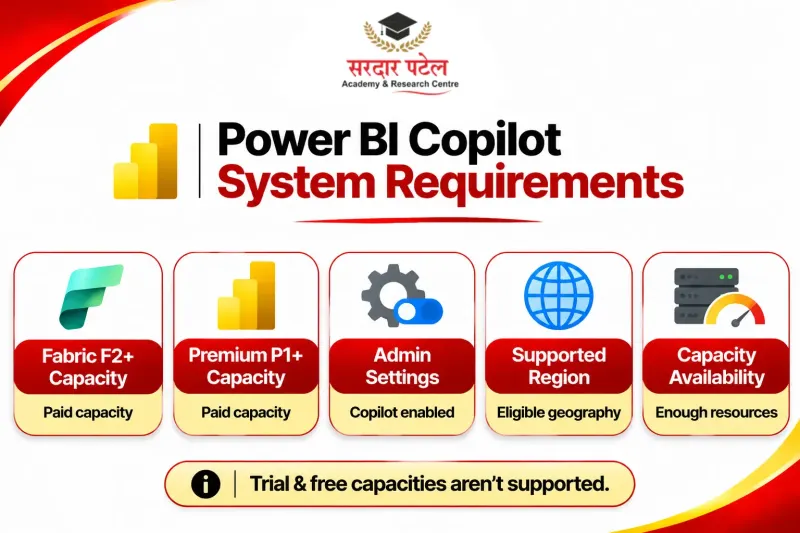
Power BI Copilot is not a switch every user can flip. According to Microsoft's requirements:
- Your organisation needs a paid Fabric capacity (F2 or higher) or Power BI Premium capacity (P1 or higher). Trial capacities and free SKUs are not supported.
- A Pro or Premium Per User licence on its own is not enough.
- Copilot is on by default, but an admin can switch it off, so the Azure OpenAI tenant setting must still be enabled. Admin steps are in Microsoft's guide to enabling Fabric Copilot. The capacity must also sit in a supported region.
- New or scaled capacity can take up to 24 hours to be recognised.
Older blog posts quote larger capacity sizes, so trust the current Microsoft page. Regional availability differs too: some experiences, such as the standalone Copilot and Copilot in apps, have not reached every region. Check Microsoft's Fabric region availability list for the region your capacity sits in.
For students, this means free Power BI Desktop alone may not give you Power BI Copilot at home, because Copilot needs a workspace on paid capacity. Build core skills first.
Limitations to Know
- Model quality sets the ceiling. Unclear column names and broken relationships lead to weak answers.
- It can be confidently wrong. A measure may look right and still mishandle filters or blanks. Our checklist for validating AI-generated data insights shows how to test them.
- Access has a cost. Paid capacity puts it out of reach for many individual learners.If you are also exploring other business intelligence platforms, check our Power BI vs Tableau Comparison to understand how these tools differ.
- It has no business judgement. It can tell you sales dropped; it cannot decide whether to cut a product line. That gap is the heart of the AI data analyst vs data analyst debate.
- Parts of it are still previewed. Features and availability can change between monthly releases.
Should Beginners Learn Copilot First?
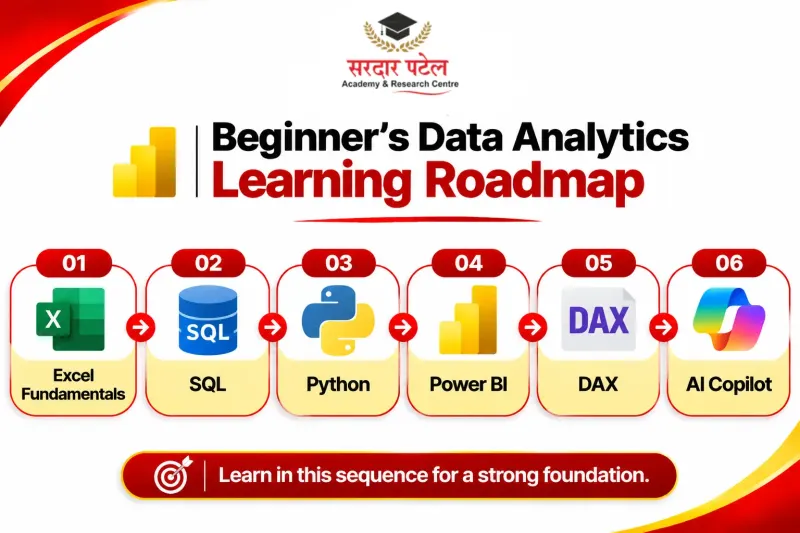
No, fundamentals first. Power BI Copilot is only as useful as your ability to judge its output. If you cannot tell whether a DAX measure is right, you cannot safely trust it.
Start with how data behaves in rows, columns and formulas. Practising in Google Sheets for data analysis builds that thinking cheaply. Then move to Power BI, where models and measures live.
How to Start Using It Responsibly
- Learn what a clean data model looks like, and name columns and measures clearly.
- Begin with questions whose answers you already know, and check Copilot against them.
- Review every DAX measure and compare each summary with the visuals.
You do not need a coding background to begin. SPARC's Data Analytics Course with AI has no strict educational eligibility and teaches Excel, SQL, Python, Power BI and Tableau from the ground up. It runs 8 months with 40+ projects, and Power BI with DAX is one module inside it.
Conclusion
Power BI Copilot in 2026 is a real productivity tool for drafting pages, explaining DAX and summarising reports. It is no shortcut around understanding data; the analysts who gain most can question its output.As Power BI continues to evolve, its role in the analytics industry is also changing. Explore the Future of Power BI Careers in India to understand the opportunities ahead.
Ready to plan your learning path? See the 8-month Data Analytics Course with AI at SPARC and decide where to begin.
Contact SPARC
Phone: +91 93129-66129
Address: 2514, Hudson Lane, Kingsway Camp (opposite Laxmi Dairy), near GTB Nagar Metro Gate 4, Delhi 110009
Website: https://sparc.org.in/contact
FAQs
No. Power BI Desktop is free to download, but Power BI Copilot needs access to paid Fabric or Premium capacity.
It speeds up drafting, but someone still has to choose the right question, check the result and explain it to decision-makers.
Yes. An April 2026 update added full back-and-forth chat with a report in the mobile app, which Microsoft labelled preview at launch.
Visuals like Key Influencers answer one defined question. Copilot takes open-ended prompts and follow-ups.
It depends on your starting level. At SPARC, the full Data Analytics Course with AI runs 8 months with 40+ projects, and Power BI with DAX is one module inside it.