+91 9312966129
 sparc.enquiry01@gmail.com


What is Data Analytics? A Beginner's Guide
Discover what data analytics is, how it works, which tools matter most in 2026, and how to start a career — explained by SPARC's industry-trained experts with real examples and salary data.
Table of Contents
- What Is Data Analytics?
- Data vs. Data Analytics — What's the Difference?
- Why Data Analytics Matters in 2026
- The Four Types of Data Analytics
- 1. Descriptive Analytics — What Happened?
- 2. Diagnostic Analytics — Why Did It Happen?
- 3. Predictive Analytics — What Will Happen?
- 4. Prescriptive Analytics — What Should We Do?
- How the Data Analytics Process Works
- Stage 1 — Data Collection
- Stage 2 — Data Cleaning
- Stage 3 — Data Organisation and Exploration
- Stage 4 — Analysis
- Stage 5 — Visualisation
- Stage 6 — Communication and Decision-Making
- Essential Tools Every Beginner Should Know
- Microsoft Excel
- SQL (Structured Query Language)
- Microsoft Power BI
- Tableau
- Python
- Statistics
- Skills Required to Become a Data Analyst
- Real-World Applications Across Industries
- Career Opportunities and Salary in India
- How to Start Learning Data Analytics — Step by Step
- Common Mistakes Beginners Make
- The Future of Data Analytics
- Conclusion
What Is Data Analytics?
Data analytics is the process of collecting, cleaning, organising, analysing, and interpreting data to discover useful insights and support better decision-making. Businesses use it to identify trends, understand customer behaviour, reduce risks, and increase profitability — replacing guesswork with evidence.
Think of it this way: every time you shop online, stream a video, or make a digital payment, you generate data. That data on its own is just noise. Data analytics is what turns that noise into a signal — a pattern, a trend, or a decision.
The global data analytics market is projected to grow at a healthy double-digit pace through the early 2030s — widely cited industry estimates put the 2032 figure anywhere from roughly $236 billion to over $1 trillion depending on how the market is defined — and separately, NASSCOM estimates a need for 11 million skilled data professionals by 2026 — making this one of the most in-demand career fields for students and graduates entering the workforce today.
Whether you're a student deciding on a career, a working professional looking to upskill, or a business owner trying to understand your data better, this guide covers everything you need to know to get started.
Data vs. Data Analytics — What's the Difference?
Many beginners use these terms interchangeably, but they mean very different things.
Data is raw, unorganised information — sales figures in a spreadsheet, customer records in a database, clicks on a webpage. On its own, data has almost no practical value. It's just numbers and text.
Data analytics is what you do with that data. It's the structured process of examining, cleaning, and interpreting information to answer specific business questions. The same sales spreadsheet that looked like a wall of numbers becomes, after analysis, a clear picture of which products are underperforming, which regions are growing, and where to invest next quarter.
The distinction matters because many organisations collect enormous amounts of data but struggle to use it. Research frequently cited from McKinsey suggests data-driven companies can be dramatically more likely to acquire customers and to be profitable than peers who don't use data well — the exact multiples vary by source, but the direction is consistent across studies. Collecting data is the easy part — the value is in the analysis.
Why Data Analytics Matters in 2026
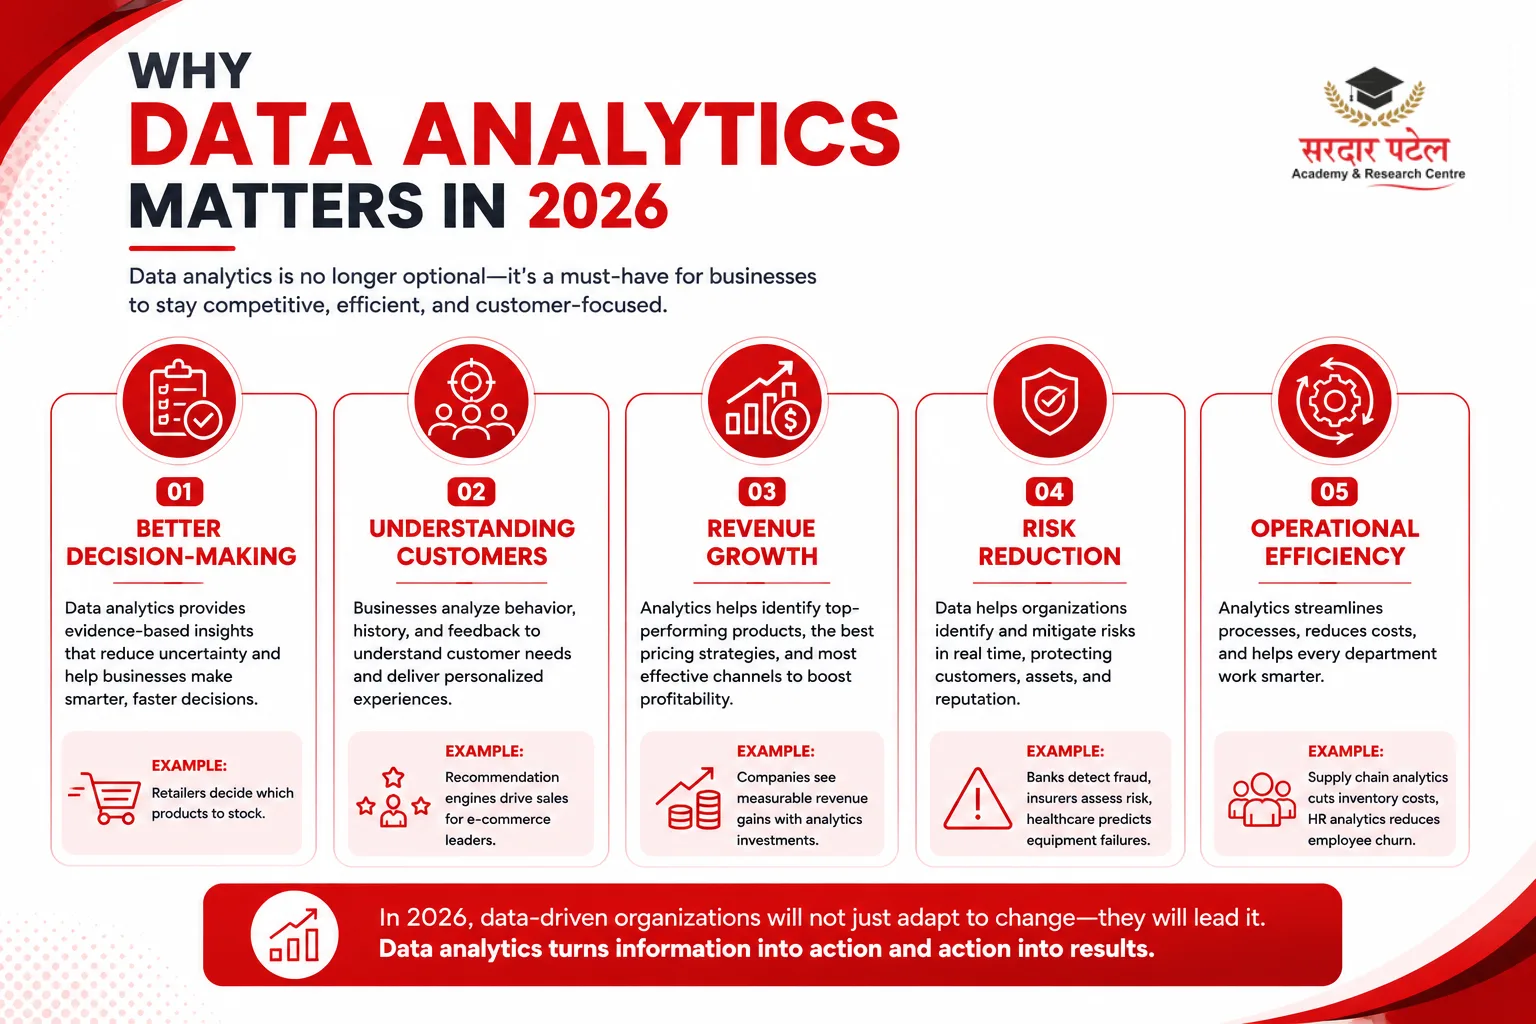
The importance of data analytics has grown sharply over the last decade, and it shows no signs of slowing. Here is why it has become non-negotiable for businesses across every industry:
- Better decision-making: Companies no longer rely solely on experience or intuition. Data analytics provides evidence-based insights that reduce uncertainty — whether a retailer is deciding which products to stock or a hospital is planning staffing levels for the next quarter.
- Understanding customers: Businesses analyse purchase history, browsing behaviour, support tickets, and feedback to build detailed pictures of what customers want. This drives personalisation — recommendation engines are widely reported to be a major revenue driver for large e-commerce players like Amazon, though exact percentage figures circulating online vary and aren't independently confirmed.
- Revenue growth: Identifying high-performing products, optimal pricing windows, and the most effective marketing channels directly improves profitability. Multiple industry analytics surveys report measurable revenue gains within the first couple of years of serious investment in analytics.
- Risk reduction: Banks use analytics to detect fraudulent transactions in real time. Insurance companies use it to assess risk before issuing policies. Healthcare systems use it to predict equipment failures before they cause patient harm.
- Operational efficiency: Supply chain analytics helps large retailers reduce inventory costs significantly. HR analytics helps organisations identify flight risks among employees before they resign. Every function in a business can be made more efficient through data.
The Four Types of Data Analytics
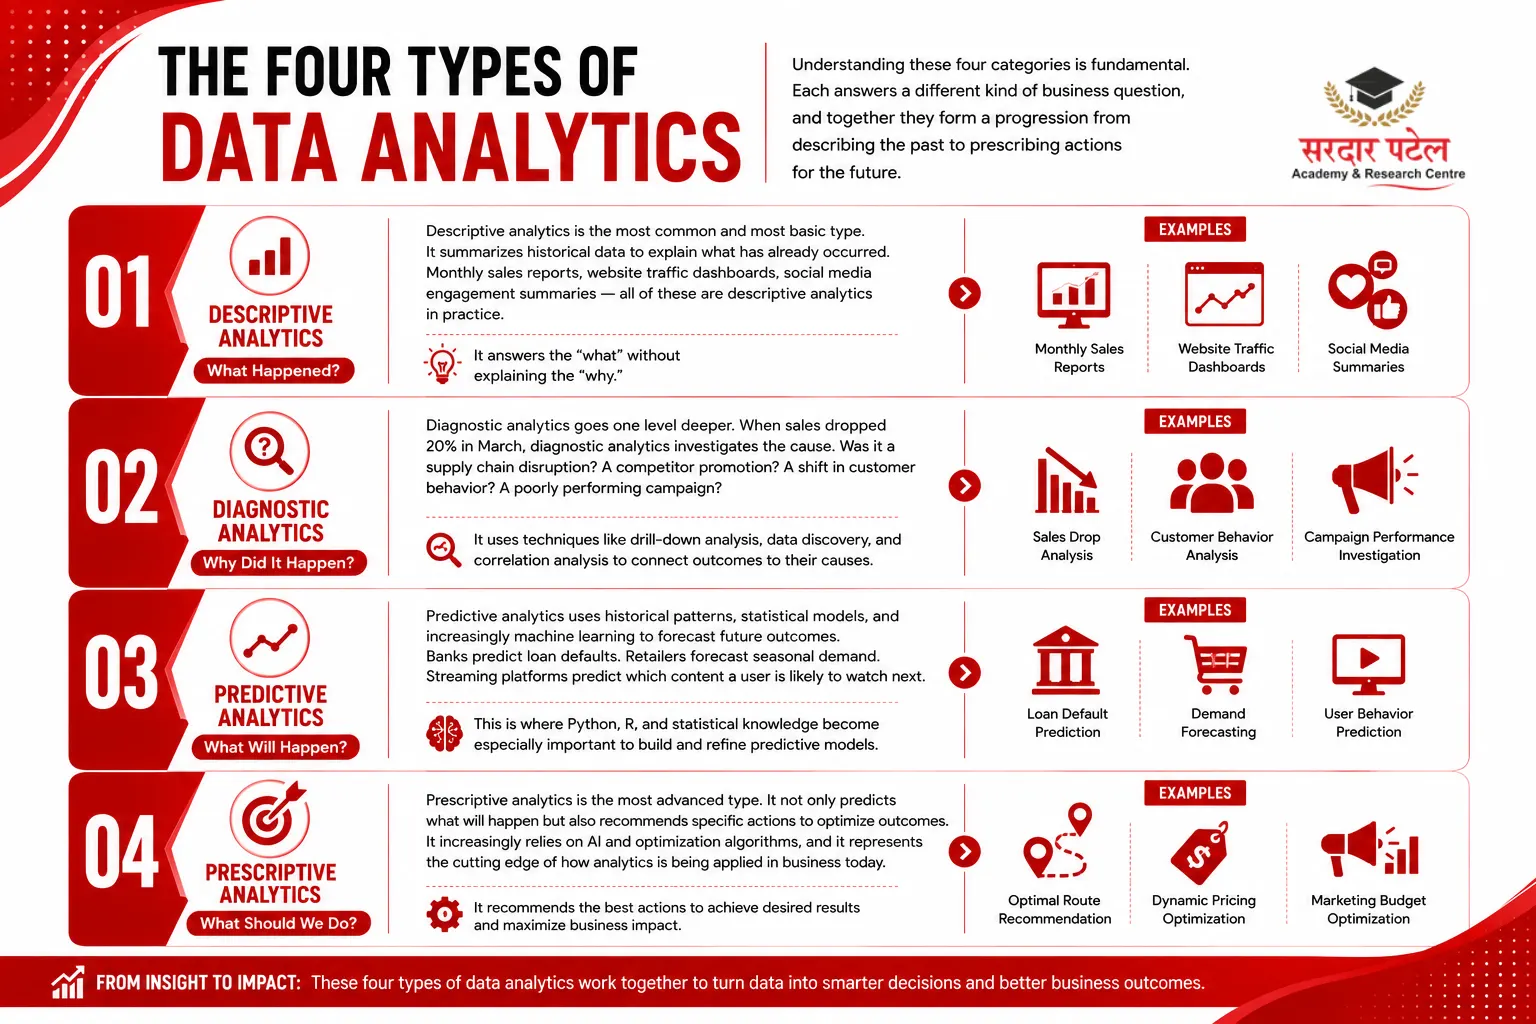
Understanding these four categories is fundamental. Each answers a different kind of business question, and together they form a progression from describing the past to prescribing actions for the future.
1. Descriptive Analytics — What Happened?
Descriptive analytics is the most common and most basic type. It summarises historical data to explain what has already occurred. Monthly sales reports, website traffic dashboards, social media engagement summaries — all of these are descriptive analytics in practice.
Most organisations start here. If you've ever looked at a chart showing last quarter's revenue by region, you've used descriptive analytics. It answers the "what" without explaining the "why."
2. Diagnostic Analytics — Why Did It Happen?
Diagnostic analytics goes one level deeper. When descriptive analytics reveals that sales dropped 20% in March, diagnostic analytics investigates the cause. Was it a supply chain disruption? A competitor promotion? A shift in customer behaviour? A poorly performing campaign?
This type uses techniques like drill-down analysis, data discovery, and correlation analysis to connect outcomes to their causes. It's where analytical thinking becomes particularly valuable — knowing which questions to ask and which variables to examine.
3. Predictive Analytics — What Will Happen?
Predictive analytics uses historical patterns, statistical models, and increasingly machine learning to forecast future outcomes. Banks predict the likelihood of loan defaults. Retailers forecast seasonal demand to manage inventory. Streaming platforms predict which content a user is likely to watch next.
This is where Python, R, and statistical knowledge become especially important. Predictive models need to be trained, validated, and refined — a more technically demanding process than descriptive or diagnostic work, but one that creates significant competitive advantage.
4. Prescriptive Analytics — What Should We Do?
Prescriptive analytics is the most advanced type. It not only predicts what will happen but also recommends specific actions to optimise outcomes. Navigation apps that suggest the fastest route based on real-time traffic are prescriptive. Ride-sharing apps that use dynamic pricing based on demand and supply are prescriptive. Marketing platforms that automatically allocate budget across channels to maximise conversions are prescriptive.
This type increasingly relies on AI and optimisation algorithms, and it represents the cutting edge of how analytics is being applied in business today.
Type | Question Answered | Example — Descriptive: What happened? / Monthly sales report. Diagnostic: Why did it happen? / Sales decline investigation. Predictive: What will happen? / Customer churn forecast. Prescriptive: What should we do? / Automated budget allocation.
How the Data Analytics Process Works
Data analytics follows a structured workflow. Understanding each stage helps you see how raw information becomes a business decision.
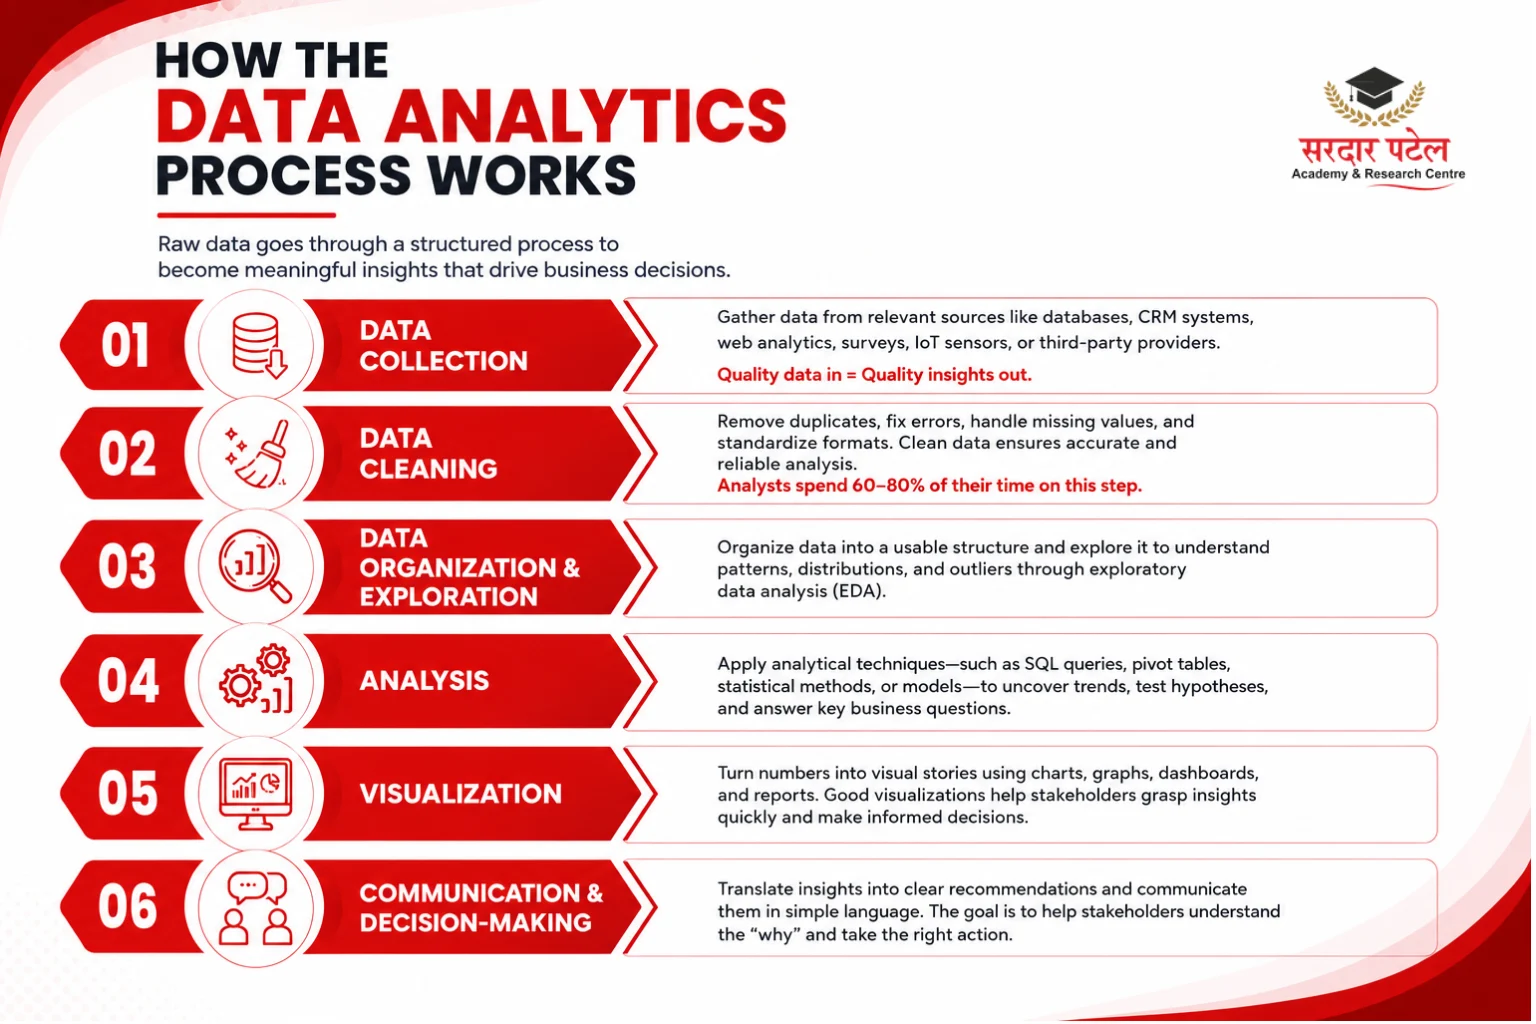
Stage 1 — Data Collection
The process begins with gathering data from relevant sources. Depending on the business problem, these might include internal databases, CRM systems, website analytics tools, social media platforms, customer surveys, IoT sensors, or third-party data providers.
The quality of your analysis depends entirely on the quality of your data at this stage. Garbage in, garbage out — a principle every analyst learns early. Poorly collected data leads to misleading conclusions, no matter how sophisticated the analysis that follows.
Stage 2 — Data Cleaning
Real-world data is rarely clean. It typically contains duplicate records, missing values, inconsistent formatting, and outright errors. A city name entered as "Delhi", "delhi", and "DELHI" in the same dataset is a simple example of the kind of inconsistency that can skew analysis if not corrected.
Data cleaning — sometimes called data wrangling — is often the most time-consuming part of the analytics process. It's commonly said in the industry that analysts spend somewhere around 60–80% of their time cleaning data rather than analysing it — a figure repeated across many surveys without one single definitive source, but consistent with what most working analysts report. Learning to do this well in Excel, SQL, or Python is one of the most valuable skills you can develop.
Stage 3 — Data Organisation and Exploration
Once cleaned, data is organised into a structure suitable for analysis. This might mean creating database tables, categorising records, or building a preliminary dataset. Analysts typically conduct exploratory data analysis (EDA) at this stage — looking at distributions, spotting outliers, and identifying initial patterns before the formal analysis begins.
Stage 4 — Analysis
This is where the core analytical work happens. Depending on the goal, analysts might calculate summary statistics, run SQL queries to compare segments, build pivot tables to identify trends, or apply statistical models to test hypotheses. The specific techniques used depend on the question being answered and the type of analytics being conducted.
Stage 5 — Visualisation
Numbers are difficult for most stakeholders to interpret directly. Visualisation converts analytical findings into charts, graphs, dashboards, and reports that communicate insights clearly and quickly. A well-designed dashboard lets a business manager understand the key performance indicators of their department at a glance without needing to understand the underlying data.
Tools like Microsoft Power BI and Tableau are built specifically for this purpose. Learning to build effective visualisations — not just technically correct ones, but ones that tell a clear story — is a skill that significantly differentiates analysts in the job market.
Stage 6 — Communication and Decision-Making
The final stage is translating analytical findings into business recommendations. This is where many technically strong analysts fall short: they can build a sophisticated model but struggle to explain what it means to a non-technical audience.
The best analysts can walk a marketing director through a campaign performance analysis, explain why a particular customer segment is declining, and recommend a specific course of action — all in plain language without losing the rigor of the underlying work.
Essential Tools Every Beginner Should Know
You do not need to learn every analytics tool at once. Start with the fundamentals and build from there. Here is a practical guide to the tools that actually matter for getting hired in India in 2026.
Microsoft Excel
Excel remains the most universally required analytics tool. According to an analysis of 500+ data analyst job postings on Naukri and LinkedIn (Q1 2026), Excel appears in over 90% of listings. Every analyst uses it for data cleaning, quick calculations, pivot table analysis, and preliminary charting.
Start here. Master VLOOKUP and INDEX-MATCH, pivot tables, conditional formatting, and basic dashboard creation before moving on. If you're completely new to spreadsheets, start with our Excel Tutorial for Data Analytics Beginners to understand the essential functions, formulas, pivot tables, and analytical techniques step by step.
SQL (Structured Query Language)
SQL is the language of databases, and it appears in roughly 85% of analyst job descriptions. It allows you to extract specific records from large databases, join multiple tables, aggregate data, and create reports — tasks that would take hours in Excel and take minutes in SQL.
For beginners, focus on SELECT, WHERE, GROUP BY, HAVING, all JOIN types, subqueries, and basic window functions. Daily practice on platforms like HackerRank or SQLZoo will build fluency quickly. To build a strong foundation in database querying, you can also explore our SQL Basics Tutorial for Students, covering the core concepts every beginner should practice.
Microsoft Power BI
Power BI has become the dominant visualisation tool in the Indian market, appearing in approximately 70% of Delhi-NCR analyst job postings (LinkedIn, Q1 2026). It integrates seamlessly with Excel and most databases, making it practical for organisations already using Microsoft infrastructure.
Power BI lets you build interactive dashboards, connect live data sources, and create calculated metrics using DAX (Data Analysis Expressions). It is the tool most likely to come up in your first analyst interview. Once you understand the basics, practice creating reports with our Power BI Dashboard Tutorial and learn how to turn raw data into interactive business dashboards.
Tableau
Tableau is the leading visualisation tool globally and is particularly common in multinational companies and product firms. While slightly less prevalent than Power BI in the Indian entry-level market, Tableau skills are highly valued, and the tool itself is excellent for building polished, publication-quality dashboards.
Python
Python has become the standard programming language for data analytics, appearing in roughly 55–60% of analyst job postings. Libraries like Pandas (data manipulation), NumPy (numerical computing), Matplotlib and Seaborn (visualisation), and Scikit-learn (machine learning) make Python a complete analytics environment.
As a beginner, do not start with Python. Learn Excel and SQL first, then add Python once you have a clear foundation. Python's value compounds as your problems become more complex — for basic reporting and dashboards, Excel and Power BI are faster and simpler. When you're ready to move beyond spreadsheets and databases, our Python Basics for Data Analytics can help you understand the fundamentals of Python and its role in data analysis.
Statistics
Statistics is not a tool in the software sense, but it is the intellectual foundation that separates analysts who understand what they're doing from those who are just running functions. Key concepts include mean, median, standard deviation, probability, correlation, regression, and statistical significance. You do not need advanced mathematics — a solid grasp of these fundamentals is enough to handle most analyst work.
Skills Required to Become a Data Analyst
Technical skills get you shortlisted. Everything else determines whether you get hired.
Technical skills: Excel, SQL, Power BI, Python (basic), statistics, and data visualisation are the core requirements. These are the tools that appear consistently across job descriptions and are tested in online assessments and technical interviews.
Business thinking: Recruiters increasingly distinguish between analysts who can produce outputs and analysts who can interpret them in business terms. The ability to look at a chart and say "this suggests our customer acquisition cost is rising faster than lifetime value, which means our current marketing strategy isn't sustainable" is far more valuable than the ability to build the chart in the first place.
Communication: Data analysts present findings to marketing managers, finance directors, and operations heads who may not understand what a standard deviation is. Explaining complex insights in plain, actionable language — both verbally and in written reports — is a skill that is genuinely scarce and genuinely valued.
Problem-solving and curiosity: The best analysts are naturally curious. They see an unexpected number in a report and want to understand why. They ask follow-up questions rather than accepting the first answer the data gives them. This intellectual habit cannot be taught by a course, but it can be cultivated through practice with real datasets.
Real-World Applications Across Industries
Data analytics is not an abstract discipline. Here is how it is being applied in industries you interact with every day.
E-commerce and retail: Flipkart and Amazon India use analytics to personalise product recommendations, optimise dynamic pricing, manage inventory across thousands of SKUs, and predict demand spikes during sale events. A single well-executed analytics decision during a Big Billion Days sale can mean hundreds of crores in additional revenue.
Banking and fintech: Paytm, HDFC Bank, and ICICI use real-time transaction analytics to detect fraud within milliseconds. Credit risk models assess loan applications using hundreds of variables beyond just credit scores. Customer segmentation helps banks design targeted products for different life stages.
Healthcare: Hospitals such as Apollo and Max Healthcare use analytics to optimise patient flow, reducing wait times and improving resource utilisation. Predictive models flag patients at high risk of readmission so clinical teams can intervene proactively.
Marketing: Digital marketing agencies track every rupee of ad spend across Google, Meta, and programmatic channels. Attribution models determine which combination of touchpoints actually drives conversions — information that directly determines how budgets are allocated.
Logistics: Companies like Delhivery and Blue Dart use route optimisation analytics to reduce delivery costs and improve on-time performance across millions of shipments.
Career Opportunities and Salary in India
Data analytics offers genuine career flexibility. Entry-level roles exist across IT, fintech, e-commerce, healthcare, consulting, and marketing — and the progression from analyst to senior analyst to analytics manager to data science roles is well-established.
Common entry-level titles include Data Analyst, Business Analyst, MIS Analyst, Reporting Analyst, and BI Analyst. As you gain experience, roles like Analytics Consultant, Product Analyst, Data Scientist, and Analytics Manager become accessible.
Salary benchmarks for India (AmbitionBox + Glassdoor India, Q1 2026):
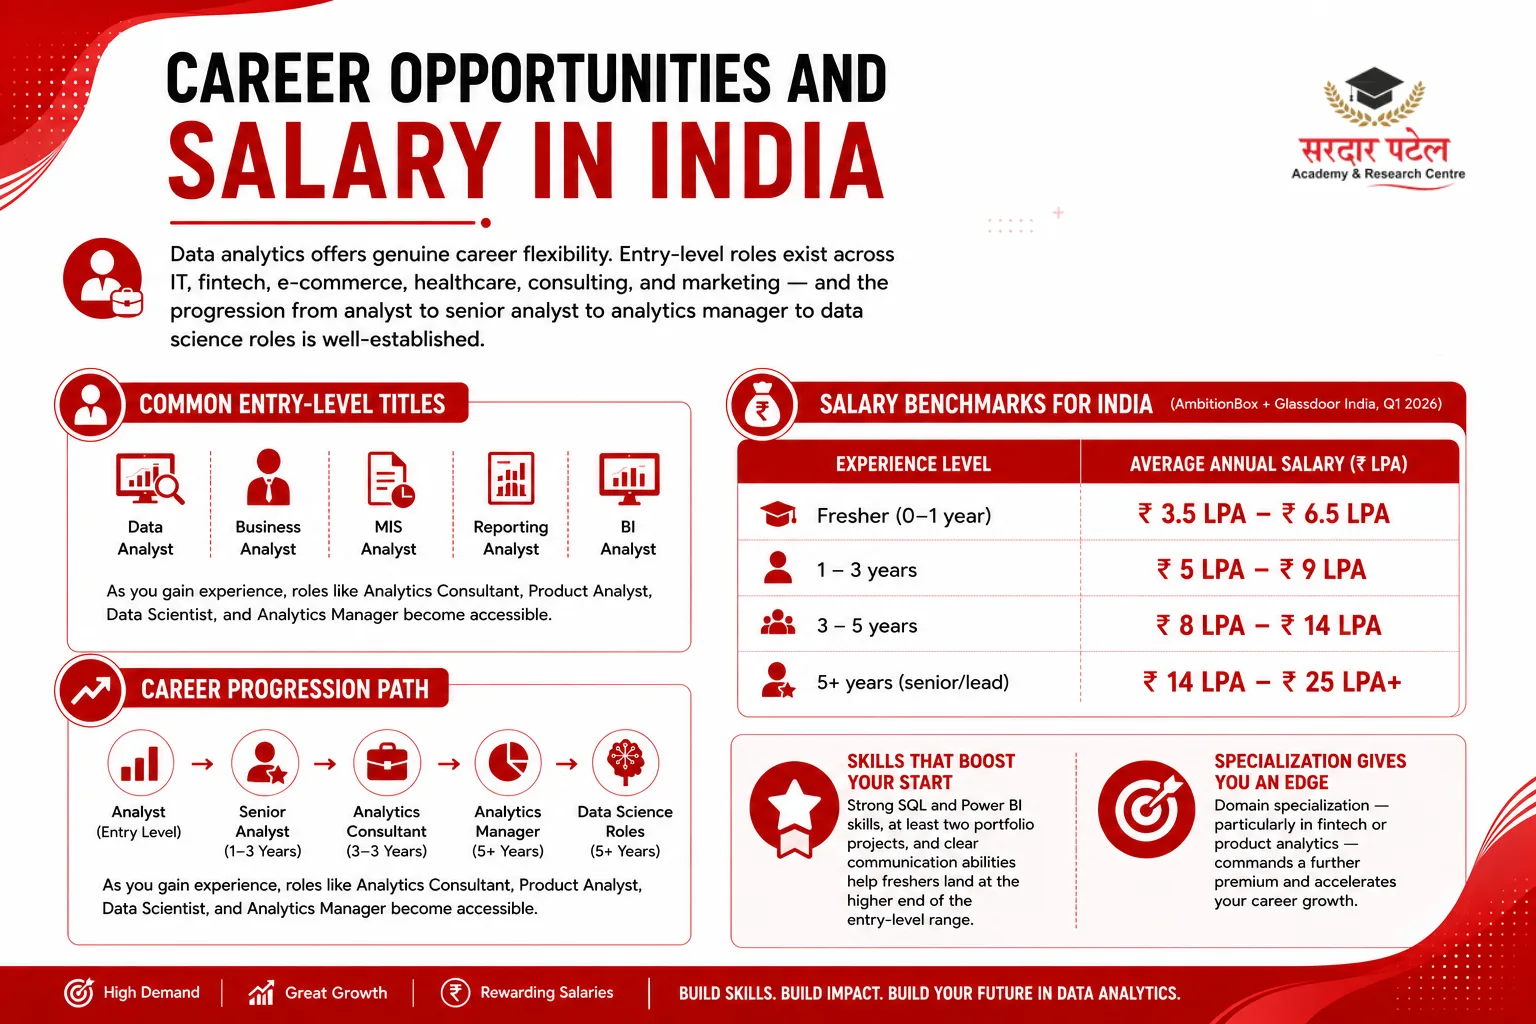
Experience Level | Average Annual Salary — Fresher (0–1 year): ₹3.5 LPA – ₹6.5 LPA. 1–3 years: ₹5 LPA – ₹9 LPA. 3–5 years: ₹8 LPA – ₹14 LPA. 5+ years (senior/lead): ₹14 LPA – ₹25 LPA+.
Freshers with strong SQL and Power BI skills, at least two portfolio projects, and clear communication abilities consistently land at the higher end of the entry-level range. Domain specialisation — particularly in fintech or product analytics — commands a further premium.
How to Start Learning Data Analytics — Step by Step
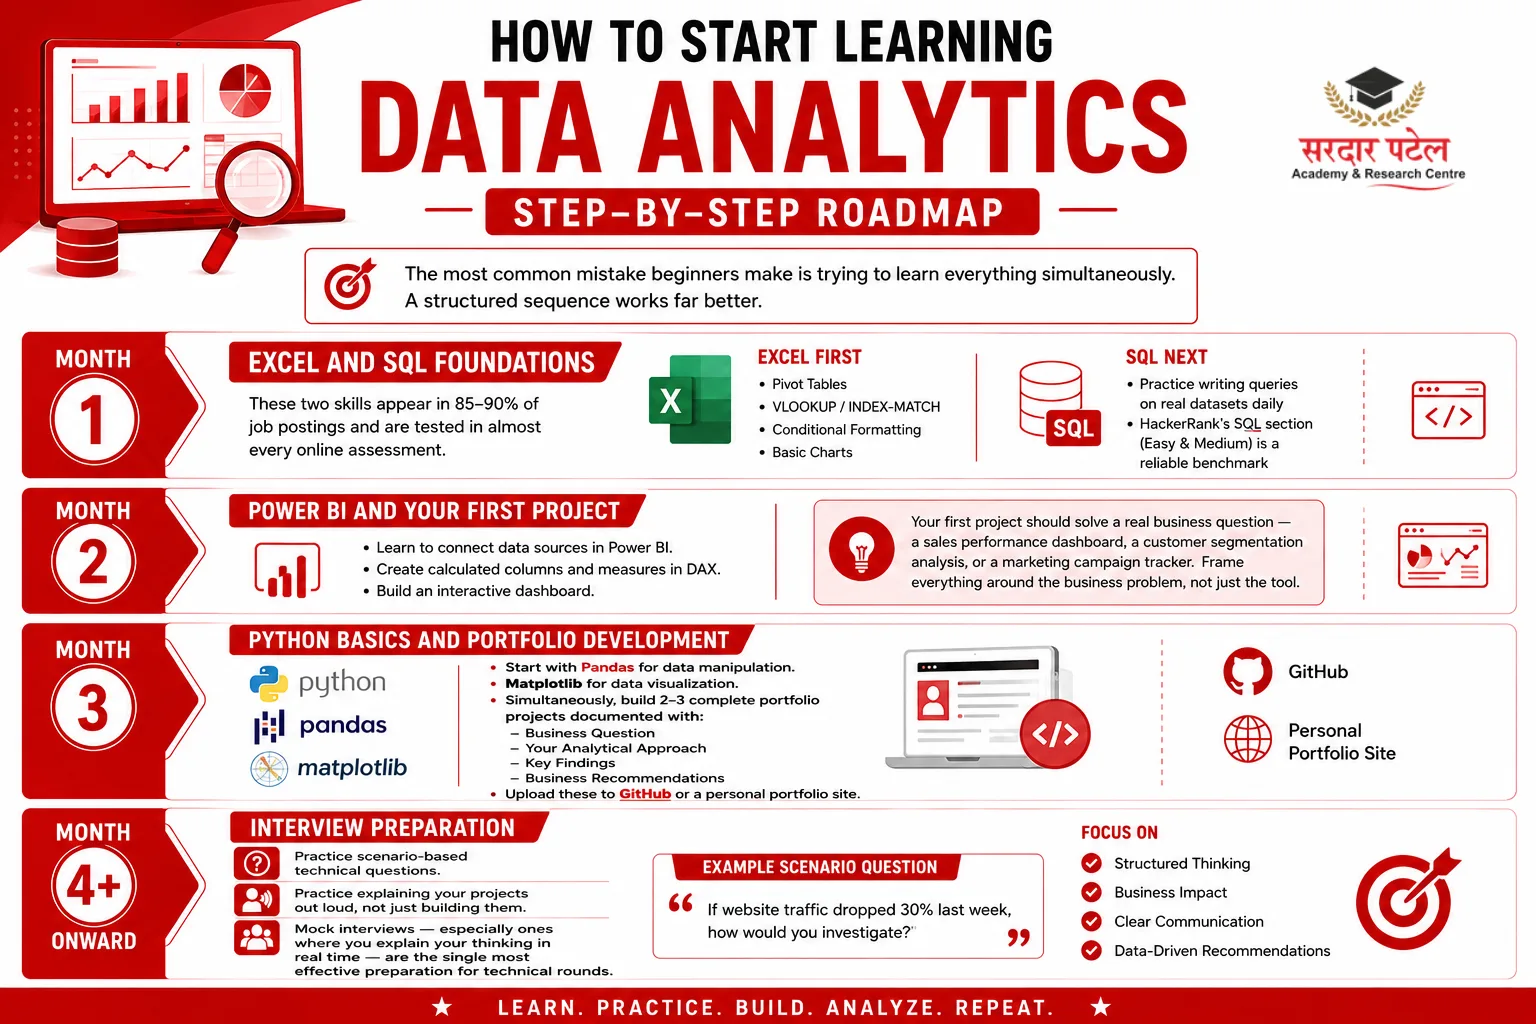
The most common mistake beginners make is trying to learn everything simultaneously. A structured sequence works far better.
Month 1 — Excel and SQL foundations. These two skills appear in 85–90% of job postings and are tested in almost every online assessment. Excel first: pivot tables, VLOOKUP/INDEX-MATCH, conditional formatting, basic charts. SQL next: practice writing queries on real datasets daily. HackerRank's SQL section at easy and medium difficulty is a reliable benchmark.
Month 2 — Power BI and your first project. Learn to connect data sources in Power BI, create calculated columns and measures in DAX, and build an interactive dashboard. Your first project should solve a real business question — a sales performance dashboard, a customer segmentation analysis, or a marketing campaign tracker. Frame everything around the business problem, not just the tool.
Month 3 — Python basics and portfolio development. Start with Pandas for data manipulation and Matplotlib for visualization. Simultaneously, build 2–3 complete portfolio projects documented with the business question, your analytical approach, key findings, and business recommendations. Upload these to GitHub or a personal portfolio site.
Month 4 onward — Interview preparation. Practice scenario-based technical questions: "If website traffic dropped 30% last week, how would you investigate?" Practice explaining your projects out loud, not just building them. Mock interviews — especially ones where you explain your thinking in real time — are the single most effective preparation for technical rounds.
Common Mistakes Beginners Make
Knowing these pitfalls in advance saves months of wasted effort.
Trying to learn everything at once. Excel, SQL, Python, Power BI, Tableau, R, and machine learning are not a checklist to complete simultaneously. Pick a sequence, master each tool before moving to the next, and build projects along the way. Breadth without depth does not impress interviewers.
Skipping data cleaning. Real-world datasets are messy. Beginners who only practice on clean, pre-formatted sample datasets are unprepared for what they encounter in actual jobs. Deliberately practice cleaning messy data — handle duplicates, fix inconsistent values, deal with missing records.
Ignoring statistics. You cannot interpret the output of an analysis you do not understand mathematically. Mean, median, standard deviation, correlation, and probability are not optional. A data analyst who does not understand these basics will regularly draw incorrect conclusions from their own work.
Building projects without business context. A dashboard is not a project. "I built a sales dashboard in Power BI" tells an interviewer nothing. "I built a dashboard that identified three underperforming product categories, leading to a pricing adjustment recommendation" is a project. Every portfolio piece needs a business question, an analytical approach, and a recommendation.
Neglecting communication skills. Technical ability gets you shortlisted. Communication is frequently what converts an interview into an offer. Practice explaining your work in simple language. If you cannot explain your analysis to someone with no data background, you do not fully understand it yourself.
The Future of Data Analytics
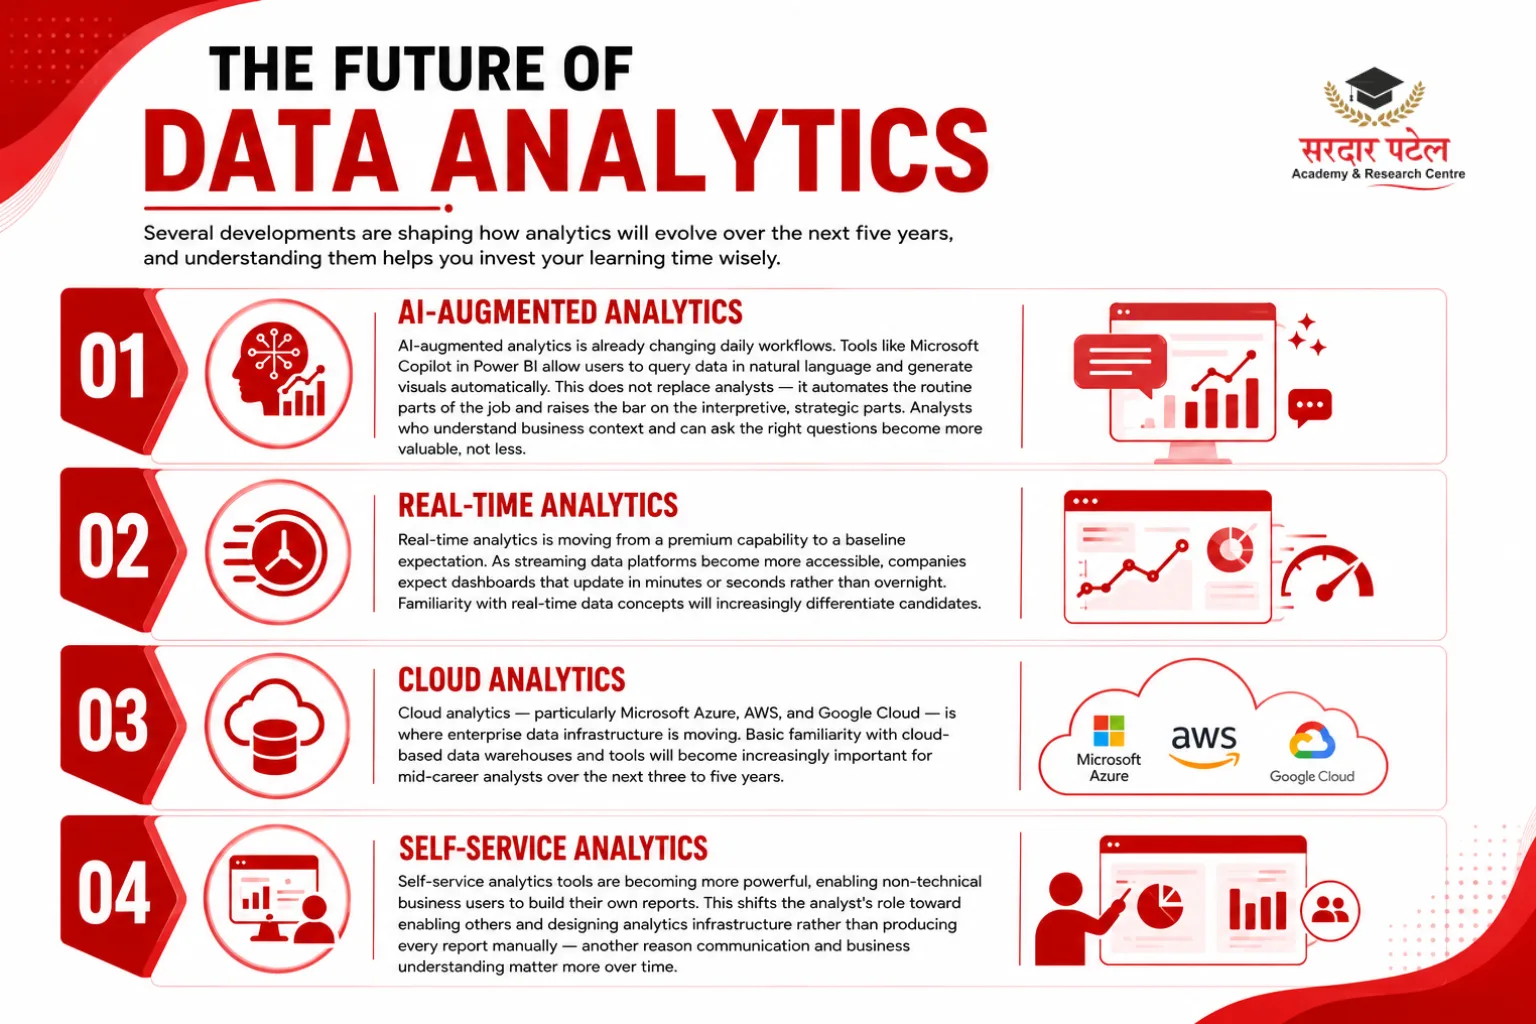
Several developments are shaping how analytics will evolve over the next five years, and understanding them helps you invest your learning time wisely.
AI-augmented analytics is already changing daily workflows. Tools like Microsoft Copilot in Power BI allow users to query data in natural language and generate visuals automatically. This does not replace analysts — it automates the routine parts of the job and raises the bar on the interpretive, strategic parts. Analysts who understand business context and can ask the right questions become more valuable, not less.
Real-time analytics is moving from a premium capability to a baseline expectation. As streaming data platforms become more accessible, companies expect dashboards that update in minutes or seconds rather than overnight. Familiarity with real-time data concepts will increasingly differentiate candidates.
Cloud analytics — particularly Microsoft Azure, AWS, and Google Cloud — is where enterprise data infrastructure is moving. Basic familiarity with cloud-based data warehouses and tools will become increasingly important for mid-career analysts over the next three to five years.
Self-service analytics tools are becoming more powerful, enabling non-technical business users to build their own reports. This shifts the analyst's role toward enabling others and designing analytics infrastructure rather than producing every report manually — another reason communication and business understanding matter more over time.
Conclusion
Data analytics is one of the most practically valuable skills you can develop in 2026. It is in demand across every major industry, is accessible to learners from any academic background, and offers a clear career path with strong salary growth over time.
The path from beginner to job-ready is straightforward if you follow a structured sequence: Excel and SQL first, then Power BI, then Python, then real projects and interview preparation. What separates candidates who get hired is not the number of tools they know — it is the ability to apply those tools to real business problems and explain what they found.
At SPARC, our Data Analytics program is designed around exactly this principle. Students work with real industry datasets from day one, build a portfolio of business-focused projects, and receive hands-on interview preparation — technical mock interviews, resume guidance, and LinkedIn optimisation — before entering the job market.
Ready to start? Explore SPARC's Data Analytics Program
FAQs
Data analytics is the process of examining data to find useful patterns, answer business questions, and make better decisions. It helps organizations replace guesswork with evidence.
Yes. India faces a significant shortage of data analytics professionals — NASSCOM estimates a gap of several million skilled workers by 2026. Entry-level salaries range from ₹3.5 to ₹6.5 LPA, with strong growth potential as skills and experience develop.
Yes. Students from commerce, economics, humanities, and management backgrounds successfully transition into analytics roles. The key is building specific technical skills — SQL, Excel, Power BI — and demonstrating them through projects. Degree subject matters less than what you can show.
Data analytics focuses on analyzing existing data to answer defined business questions — what happened, why it happened, what will happen. Data science uses more advanced programming, machine learning, and statistical modeling to solve open-ended problems and build predictive systems. Analytics is typically the more accessible starting point.
Start with Excel, then SQL, then Power BI. These three tools cover the vast majority of entry-level analyst work and appear most frequently in job postings. Add Python after you have a solid foundation in the first three. Learning Python before Excel and SQL is a common beginner mistake that slows progress.
Indian companies use analytics across industries: Paytm for fraud detection, Flipkart for demand forecasting, Apollo Hospitals for patient flow management, digital marketing agencies for campaign optimization, and banks for credit risk assessment. Almost every large organization in India now has some form of analytics function.
With consistent effort — roughly 2–3 hours daily — most beginners can build sufficient skills for entry-level roles in 3–6 months. The key is combining structured learning with real project work from the beginning, not waiting until you feel "ready" to start building.
No. While a technical background helps, it is not required. Many successful data analysts come from commerce, economics, statistics, and even arts backgrounds. What matters is the ability to learn the tools, think analytically, and communicate clearly — none of which requires an engineering degree.