+91 9312966129
 sparc.enquiry01@gmail.com


How Students Can Build Data Analytics Portfolio
A step-by-step data analytics portfolio guide for students — pick the right projects, avoid common mistakes, and build a portfolio recruiters notice.

Table of Contents
- What This Data Analytics Portfolio Guide Covers
- Why Employers Actually Care About Portfolios
- Step-by-Step: How to Build Your Data Analytics Portfolio
- Step 1: Learn the Core Tools Before You Start Projects
- Step 2: Choose Projects That Solve Real Problems
- Step 3: Follow a Consistent Project Structure
- Step 4: Document Your Process, Not Just Your Output
- Step 5: Host Your Portfolio Somewhere Easy to Find
- Common Mistakes Students Make While Building a Portfolio
- Beginner vs Advanced Portfolio Projects: A Quick Comparison
- How Many Projects Do You Actually Need?
- Building Confidence Through Guidance, Not Just Self-Study
- Final Thoughts: Start Small, Stay Consistent
If you're a student trying to break into data analytics, you've probably heard the same advice a hundred times: "build a portfolio." But nobody tells you what that actually means in practice — which projects to pick, how to present them, or how to avoid the trap of copying the same Titanic dataset tutorial everyone else on LinkedIn has already posted.
This data analytics portfolio guide walks you through the entire process step by step — from choosing the right projects to presenting them in a way recruiters and hiring managers actually pay attention to. Whether you're a college student in Delhi NCR preparing for campus placements or a self-taught learner switching careers, the process is largely the same: pick real problems, show your thinking, and package it cleanly.
By the end of this data analytics portfolio guide, you'll know exactly how to structure your portfolio, which tools to learn first, and how to avoid the common mistakes that make most student portfolios blend into the crowd.
What This Data Analytics Portfolio Guide Covers
Before the step-by-step process, it helps to be clear on what you're actually building. A data analytics portfolio is a curated collection of projects that demonstrate your ability to work with data — collecting it, cleaning it, analysing it, and communicating what you found. It's not a resume, and it's not a certificate list. It's proof.
Think of it as the difference between telling someone you can swim and actually jumping into the pool in front of them. A certificate says you attended a course. A portfolio shows what you did with what you learned.
For students specifically, a portfolio matters even more because you likely don't have years of work experience to lean on. Recruiters hiring for entry-level analyst roles often care less about your degree and more about whether you can genuinely work with messy, real-world data.
Why Employers Actually Care About Portfolios
Hiring managers reviewing dozens of resumes for a single analyst opening rarely have time to interview everyone. A strong portfolio does some of that filtering for them before you even walk into the room.
Here's what a good portfolio signals to an employer:
- You can work independently on a problem from start to finish
- You understand how to ask the right questions of data, not just run formulas
- You can communicate findings to someone who isn't technical
- You've actually used the tools listed on your resume, not just studied them
This is exactly why analytics portfolio projects for students matter more than another certificate. A certificate proves attendance. A project proves capability.
Step-by-Step: How to Build Your Data Analytics Portfolio
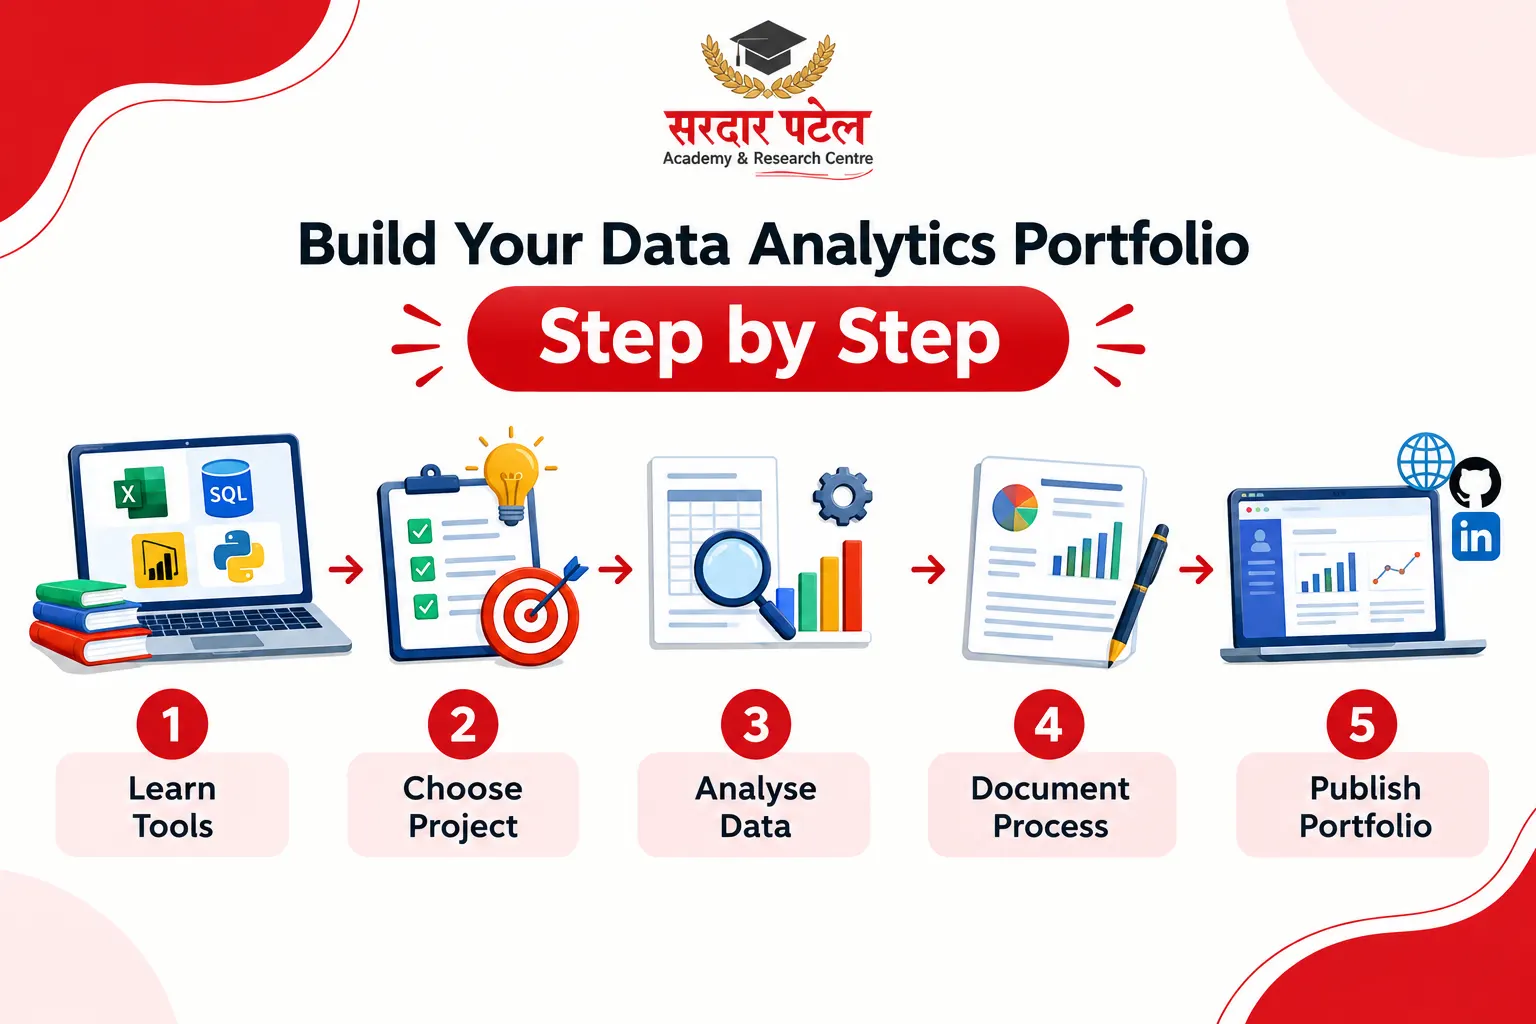
Step 1: Learn the Core Tools Before You Start Projects
You don't need to master everything, but you do need working knowledge of a few essentials before your projects will hold up under scrutiny.
| Tool |
What It's Used For |
Priority for Beginners |
| Excel / Google Sheets |
Data cleaning, pivot tables, basic analysis |
High |
| SQL |
Querying and managing structured data |
High |
| Power BI or Tableau |
Building dashboards and visual reports |
High |
| Python (Pandas, NumPy) |
Deeper analysis, automation, statistics |
Medium |
| Basic statistics |
Understanding trends, correlation, significance |
High |
You don't need to learn all five before starting your first project. To explore these tools in more detail, check out our guide to data analytics tools every beginner should know
Most students begin with Excel and SQL, then layer in a visualization tool once they're comfortable pulling and cleaning data. If you want a structured path before starting your portfolio, our data analytics learning guide can help you understand what to learn and in what order.
Step 2: Choose Projects That Solve Real Problems
This is where most student portfolios fall flat — the same recycled datasets (Titanic survival, Iris flowers) show up in portfolio after portfolio. They're fine for learning syntax, but they don't show original thinking.
Instead, look for problems connected to industries or situations you actually understand. Some examples that work well:
- Retail sales analysis — analysing seasonal sales patterns for a local business or public retail dataset.
- Personal finance dashboard — tracking and visualising your own spending habits over six months.
- College placement trends — analysing placement data (anonymised or public) to identify which skills correlate with faster hiring.
- Public transport or traffic data — relevant if you're based in a city like Delhi NCR, where data.gov.in, India's Open Government Data platform, publishes public datasets on transport and air quality that anyone can download and analyse- Kaggle.
- E-commerce customer behaviour — using open datasets to study what drives repeat purchases
The goal isn't complexity for its own sake. A simple project with a clear question, clean analysis, and honest conclusion beats an overly ambitious one that's half-finished or copied from a tutorial.
Step 3: Follow a Consistent Project Structure
Every project in your portfolio should follow a logical flow, so anyone reviewing it — technical or not — can follow your thinking:
- The question — what problem are you trying to answer?
- The data — where did it come from, and what did you have to clean or fix?
- The method — what tools and approach did you use, and why?
- The findings — what did the data actually show?
- The takeaway — what would you recommend based on this, and what are the limitations?
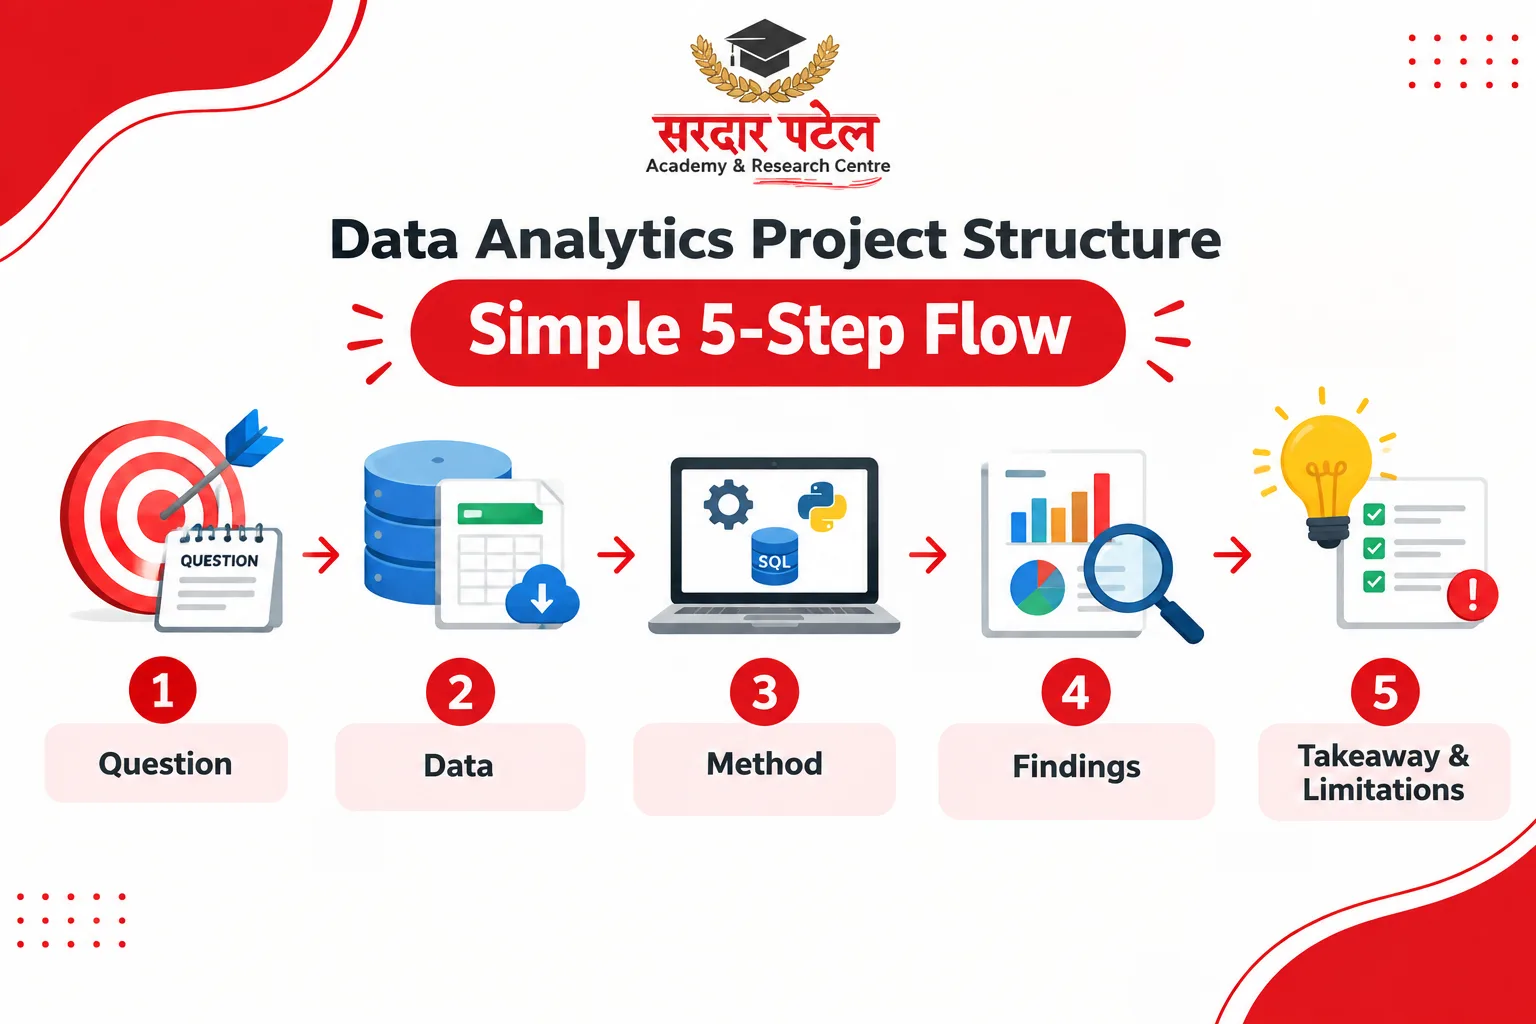 That last step — limitations — is often skipped, but it's one of the things that separates a genuinely thoughtful analyst from someone just running through steps. Good analysts know what their data can't tell them, too.
Step 4: Document Your Process, Not Just Your Output
A polished chart with no explanation tells a reviewer very little. What makes analytics portfolio projects for students genuinely useful is the narrative around them — the decisions you made and why.
For each project, write a summary covering:
- Why you chose this problem
- What assumptions you made about the data
- Any dead ends or corrections along the way
- What you'd do differently with more time or better data
This kind of documentation shows judgment, which is exactly what employers are trying to assess.
Step 5: Host Your Portfolio Somewhere Easy to Find
Once your projects are ready, they need a home. A few common options:
- GitHub — ideal for code-heavy projects (Python, SQL scripts)
- A personal website or Notion page — good for presenting projects with narrative and visuals together
- LinkedIn Featured section — useful for surfacing your best 2–3 projects to recruiters browsing your profile
- Tableau Public — free hosting specifically for interactive dashboards
You don't need all four. Pick one primary home for your full portfolio, and use LinkedIn to point toward your best work.
Common Mistakes Students Make While Building a Portfolio
Even motivated students tend to repeat the same few mistakes:
- Too many shallow projects instead of a few deep ones. Five rushed projects are less convincing than two well-documented ones.
- Skipping the "why." Charts without context leave the reviewer guessing at your reasoning.
- Ignoring data cleaning. Real datasets are messy — showing that you can handle missing values, duplicates, and inconsistent formatting matters as much as the final chart.
- Copying tutorials without modification. If your project looks identical to a popular YouTube walkthrough, it won't stand out — and experienced reviewers usually recognise it.
- No clear takeaway. Ending a project with a chart and no conclusion misses the point of analysis, which is to inform a decision.
Beginner vs Advanced Portfolio Projects: A Quick Comparison
| Aspect |
Beginner-Level Project |
Advanced-Level Project |
| Data source |
Clean, public datasets |
Messy, real-world or scraped data |
| Data source |
Excel, basic SQL |
SQL, Python, Power BI/Tableau |
| Analysis depth |
Descriptive (what happened) |
Diagnostic/predictive (why, and what's next) |
| Presentation |
Static charts |
Interactive dashboard |
| Documentation |
Basic summary |
Full write-up with limitations and recommendations |
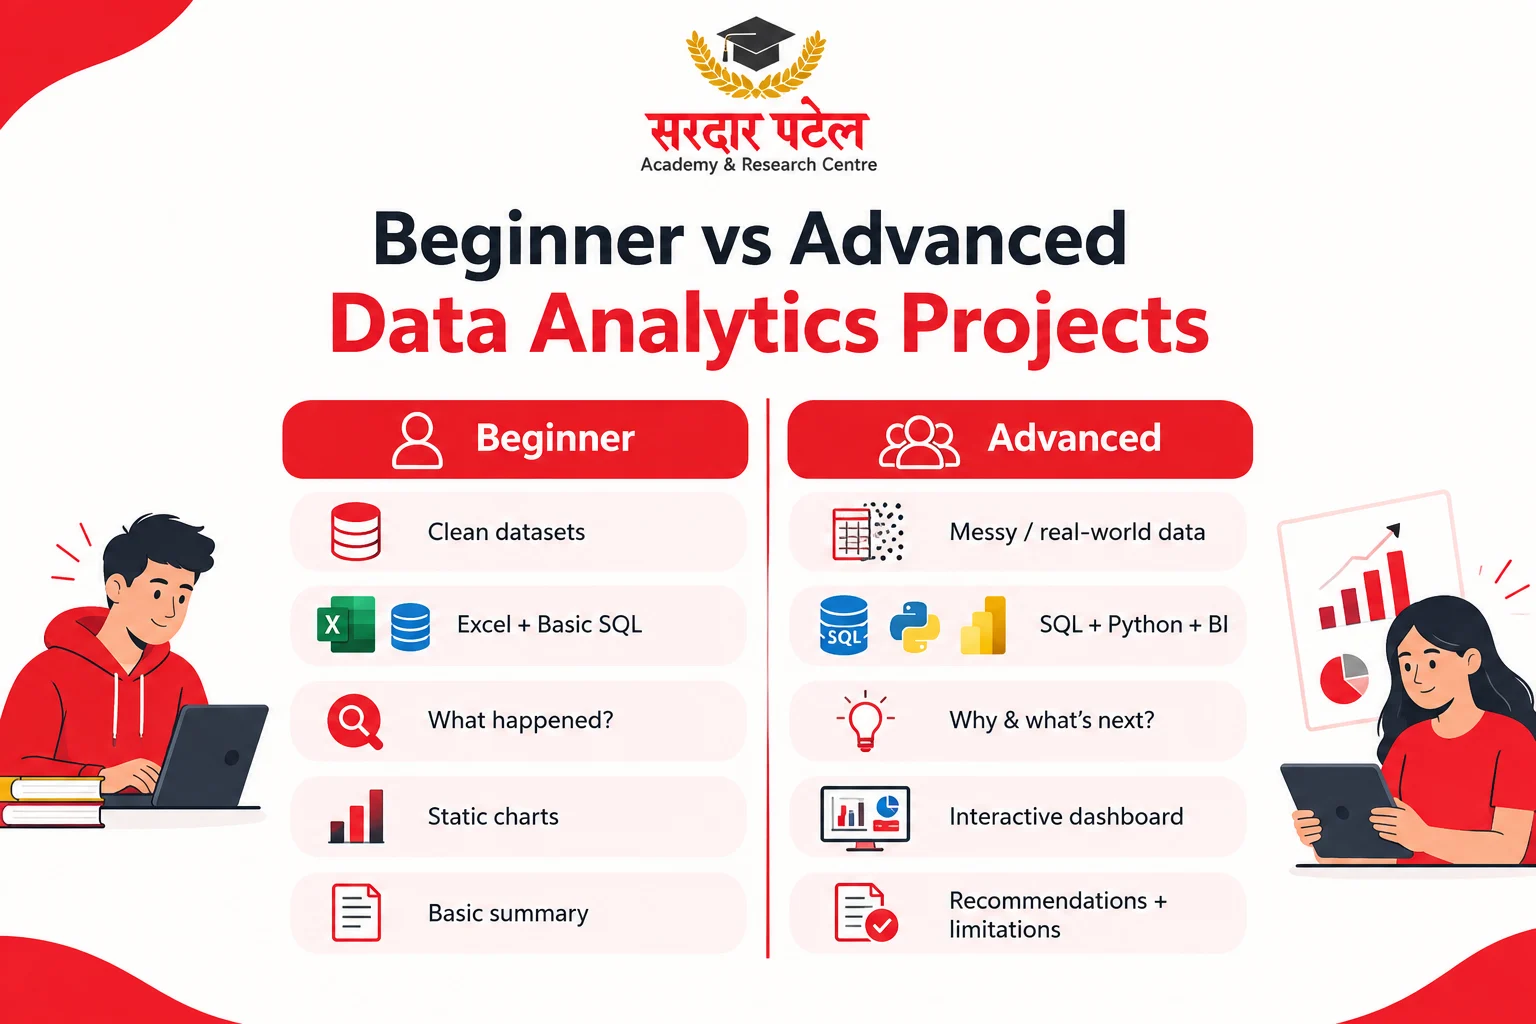
If you're just starting, don't feel pressure to jump straight to the advanced column. A well-executed beginner project is far more valuable than a poorly executed advanced one. As you build more advanced projects, it is also useful to understand the data analytics career scope, skills, and salaries associated with different roles.
How Many Projects Do You Actually Need?
There's no fixed number, but most successful student portfolios settle around 3 to 5 well-developed projects rather than a long, shallow list. Quality of thinking matters more than quantity of charts.
A reasonable mix looks like:
- One project showing data cleaning and preparation skills
- One project showing dashboard or visualization skills
- One project with a written business recommendation based on findings
If you're preparing this alongside coursework or campus placements, tools like our Best Free Tools for Data Analytics roundup can help you get started without needing paid software licences.
Building Confidence Through Guidance, Not Just Self-Study
Building a portfolio alone can feel directionless, especially when you're not sure if your project choices or analysis approach make sense to someone hiring. Structured feedback from people who've actually worked in analytics roles — rather than just guessing based on YouTube comments — tends to shortcut a lot of trial and error.
If you want a sense of how analytics professionals actually evaluate student work, our interview with analytics faculty covers what reviewers look for beyond just the final chart. If you're also exploring the right learning path and career options, our guide to data analytics course eligibility and career opportunities can help you understand what comes next.
And if you're a commerce background student wondering whether analytics is even a realistic path for you, it's worth reading about data analytics jobs for commerce students — the field is far more open to non-engineering backgrounds than most students assume.

Final Thoughts: Start Small, Stay Consistent
Building a data analytics portfolio isn't about impressing people with complexity — it's about proving, clearly and honestly, that you can take a real question, work through messy data, and land on a conclusion that makes sense. Start with one project you genuinely find interesting, document your thinking as you go, and build outward from there.
If you'd like structured guidance while you build your first few projects — including mentorship, tool access, and feedback from people who've actually worked in analytics roles — reach out to Sardar Patel Academy & Research Centre to build an industry-ready portfolio with support at each step, instead of figuring it all out alone. Get in touch to start building yours →
FAQs
Not necessarily at the start. Excel and SQL alone can support solid beginner projects. Python becomes more useful as you take on deeper statistical or automation-heavy work.
This varies by individual pace and project depth, but most students building 3–5 solid projects alongside their studies take a few months, not weeks. Depth matters more than speed here.
Public datasets — from government open-data portals like data.gov.in or platforms like Kaggle — are the safer and more common choice for students, since real company data usually involves confidentiality restrictions.
Not strictly. If your work is mostly Excel or dashboard-based, a personal website, Notion page, or Tableau Public profile can work just as well as GitHub.
Focus on original problem choices, clear documentation of your thinking, and honest discussion of limitations — these are the details most portfolios skip.
Yes, but clearly state your specific contribution. Reviewers want to know what you did, not just what the team produced.
Quality, consistently. A recruiter skimming your portfolio will judge you on your best project, not your total count.