+91 9312966129
 sparc.enquiry01@gmail.com


Best Free Tools for Data Analytics
Looking for free tools for data analytics? Compare 10 beginner-friendly picks, from Sheets and Power BI to Python and SQL, and find where to start.
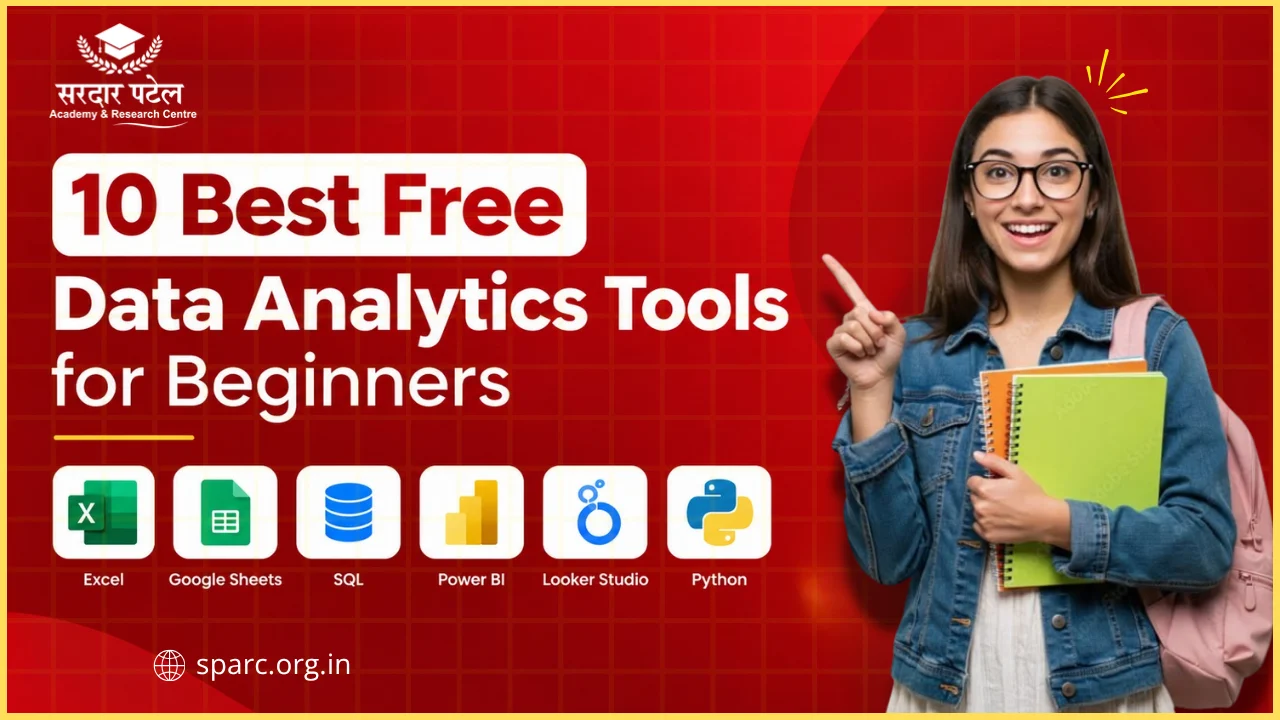
Table of Contents
- What Are Free Tools for Data Analytics?
- Spreadsheets: The Gentlest Way to Start
- Google Sheets and Excel for the web
- Free Data Visualisation Tools and Business Intelligence Tools
- Power BI Desktop
- Looker Studio
- Tableau Public
- Open-Source Analytics Tools for Code and Statistics
- Python with Jupyter Notebook or Google Colab
- R and RStudio
- SQL with SQLite, MySQL or PostgreSQL
- No-Code and Data Cleaning Tools
- KNIME Analytics Platform
- Orange Data Mining
- OpenRefine
- Free Tools for Data Analytics Compared at a Glance
- How to Choose Analytics Software for Beginners
- Build Your First Dashboard in 6 Steps
- A 12-Week Plan for Beginners
- Practise on Local Data in Delhi NCR
- Common Mistakes Beginners Make (and Tips That Help)
- Mistakes to avoid
- Tips that save time
- Conclusion: Start Small, Build One Real Project
Every beginner hits the same wall. You search for a place to start, find fifteen tools with fifteen opinions, and many of them want a credit card. Which ones are actually worth your time?
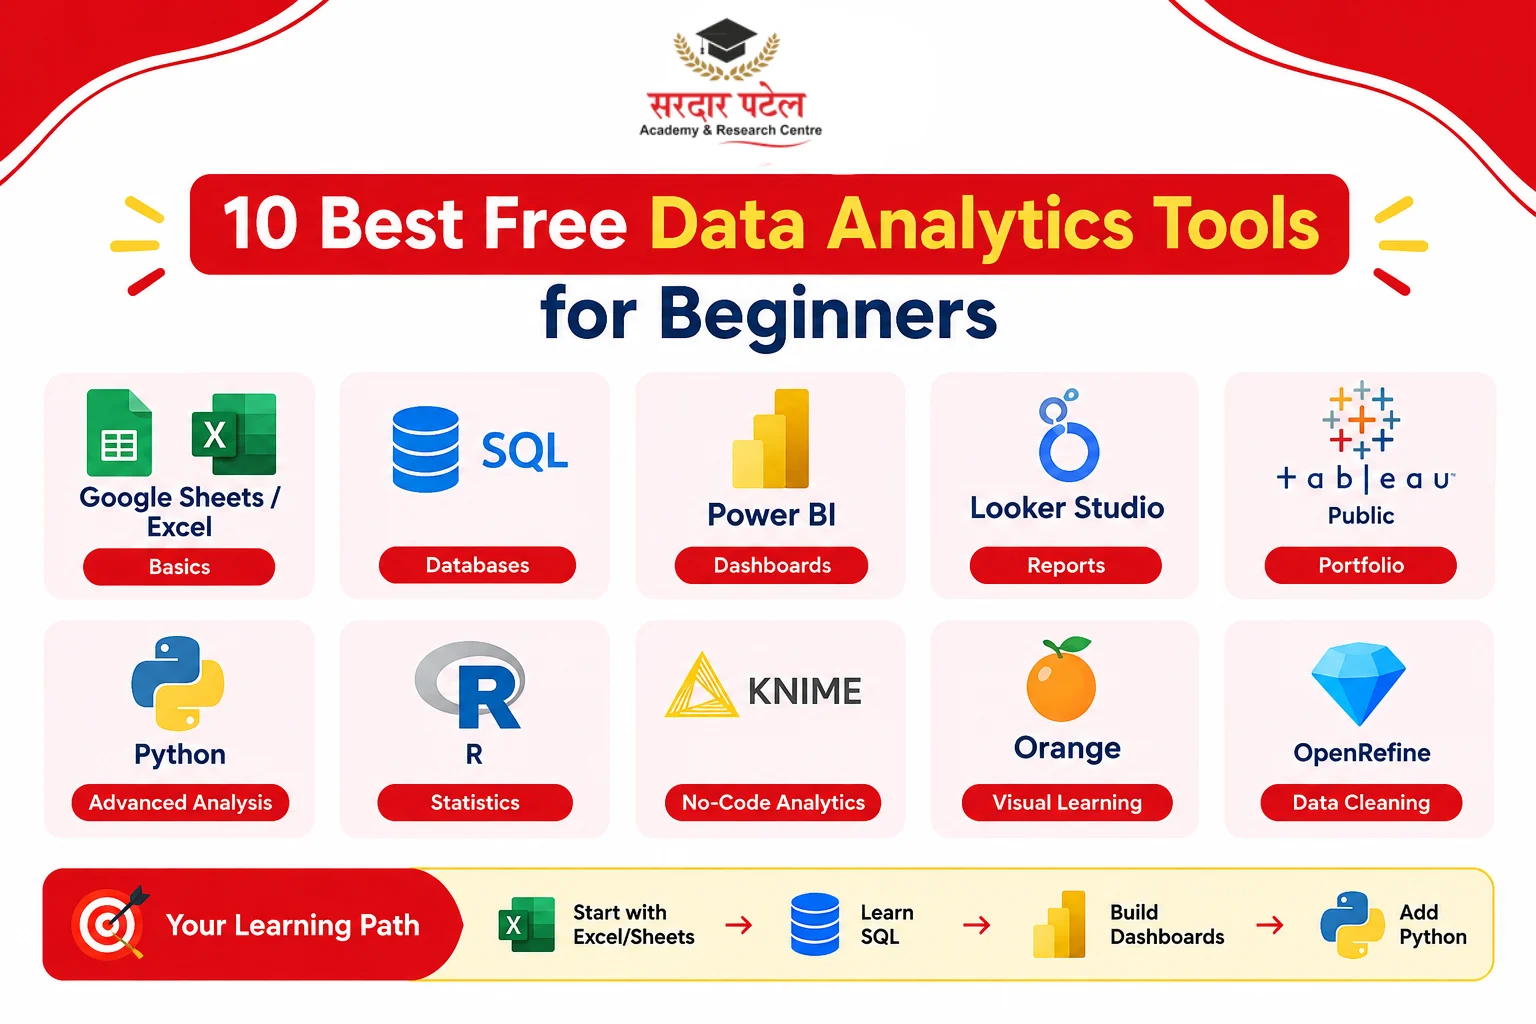
Here's the good news: most free tools for data analytics are the same ones professionals use at work. This guide compares ten of them (a couple of entries group closely related tools, like Sheets with Excel for the web), shows who each one suits, and gives you a 12-week path so you don't end up with six half-learned tools. It's written for students, working professionals, and small business owners, with examples that make sense in Delhi NCR.
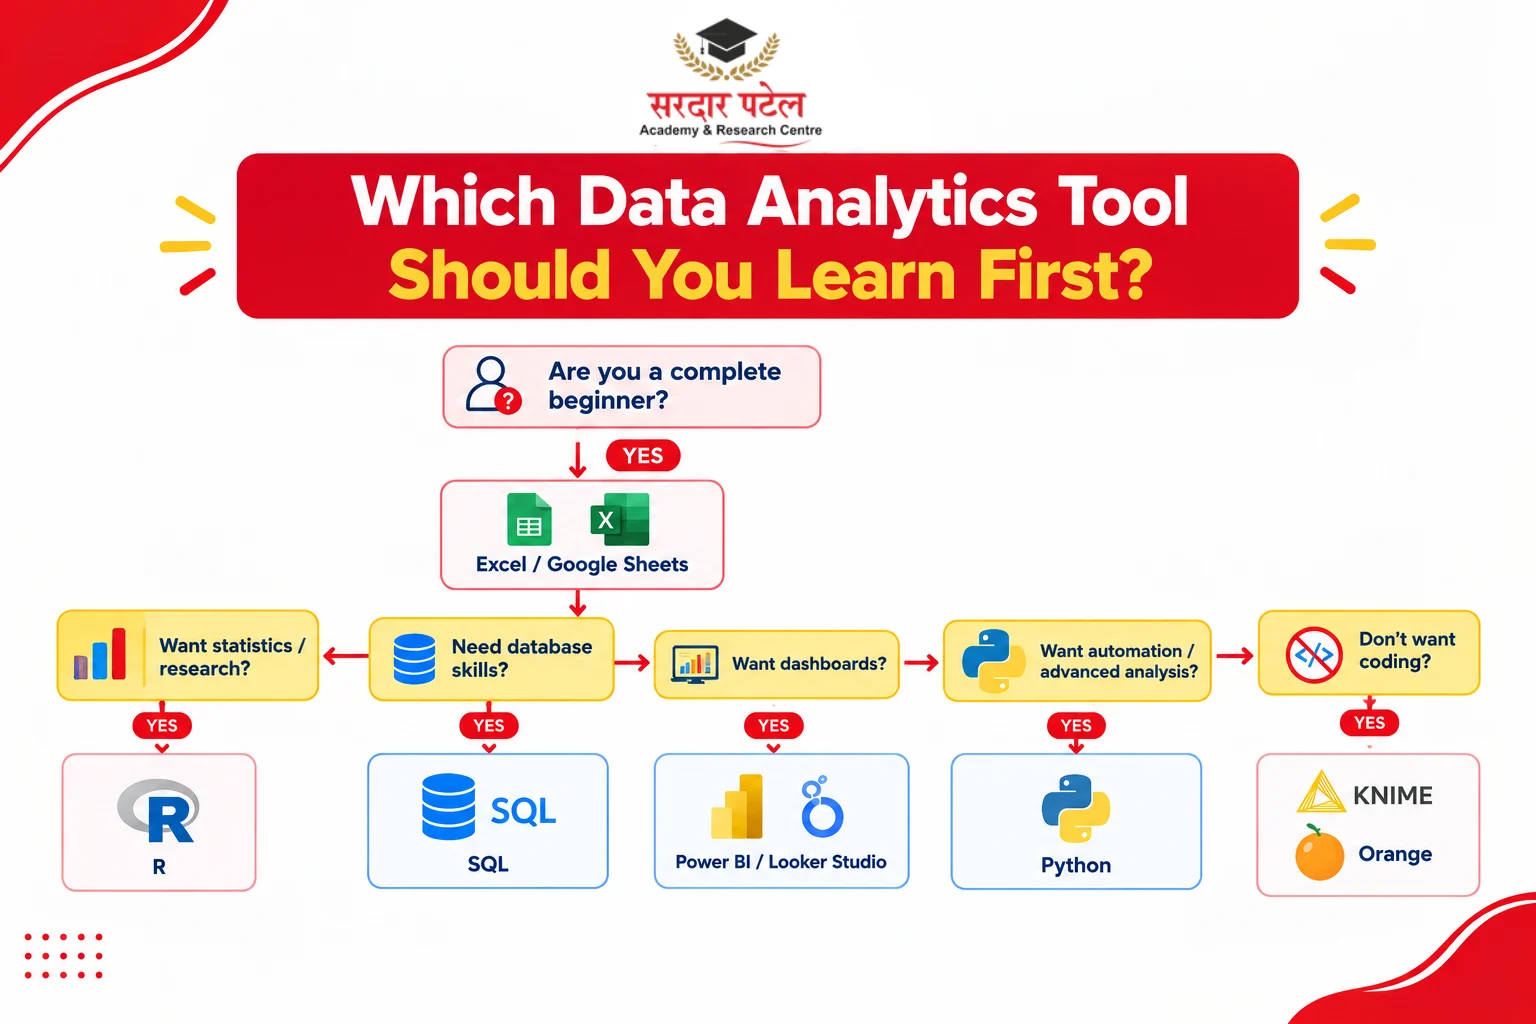
Quick answer: The best free tools for data analytics for beginners are Google Sheets or Excel for the web, SQL, and a dashboard tool such as Power BI Desktop or Looker Studio. Add Python once the basics feel comfortable. R suits statistics-heavy study, while KNIME and Orange help if you'd rather avoid code
What Are Free Tools for Data Analytics?
Free tools for data analytics are programs that let you collect, clean, analyse, and visualise data at no cost. They fall into two groups:
- Open-source tools, which anyone can use and modify: Python, R, SQLite, KNIME, Orange, and OpenRefine.
- Free editions of commercial software and cloud tools: Power BI Desktop, Tableau Public, Looker Studio, Google Sheets, Excel for the web, and Google Colab.
Free doesn't always mean unlimited. Sharing and publishing limits are usually where paid plans begin, so read the terms before loading business data into any of these free data analysis tools.
Spreadsheets: The Gentlest Way to Start
Google Sheets and Excel for the web
Best for: sorting, filtering, formulas, pivot tables and quick charts.
If you have never analysed data before, begin here. Of all the free tools for data analytics, spreadsheets are the easiest to learn. Both Google Sheets and Excel for the web run in a browser with a free Google or Microsoft account, and they teach the logic every other tool borrows: rows, columns, formulas and lookups. For a step-by-step introduction, see our Excel Tutorial for Data Analytics Beginners.
A shop owner tracking monthly sales can find the best-selling product in minutes with a pivot table, which is simply a summary table you build by dragging fields around.
Expect slowdowns on very large files, and fewer features in Excel for the web than the desktop app. Our data cleaning tutorial for beginners, which uses Excel formulas, is a good next step.
Free Data Visualisation Tools and Business Intelligence Tools
Once your data is tidy, these free tools for data analytics turn it into dashboards: single screens of charts and numbers that answer a business question at a glance.
Power BI Desktop
Best for: interactive dashboards and reporting.
Power BI Desktop is Microsoft's free authoring tool. It connects to Excel files, CSVs, and databases, and includes a built-in data-cleaning step called Power Query. Its formula language, DAX, can wait until later.
Two catches: it runs only on Windows, and sharing reports with colleagues generally requires a paid licence. It works well for practice and personal projects, but check Microsoft's current pricing and licensing terms before planning team use.
Looker Studio
Best for: shareable, browser-based reports.
Looker Studio is Google's free reporting tool. It plugs into Google Sheets, Google Analytics, and Search Console, so a small business can build a live sales or website dashboard and share it by link. It is lighter than Power BI for heavy calculations, which suits beginners.
Tableau Public
Best for: polished visuals and a public portfolio.
Tableau Public is the free edition of Tableau. You can build striking interactive charts and publish them online for recruiters to see. The trade-off matters: everything you publish is public, so use only open or sample data, never client or employer files.
Open-Source Analytics Tools for Code and Statistics
Python with Jupyter Notebook or Google Colab
Best for: cleaning large datasets, automating repeat tasks and, later, machine learning.
Among free tools for data analytics, Python is the most flexible option on this list. Libraries such as pandas (a toolkit for working with tables of data) and Matplotlib (for charts) do the heavy lifting, and Google Colab runs Jupyter-style notebooks in your browser with nothing to install. Expect a steeper climb than spreadsheets. Python for data analysis rewards patience, but the first few weeks can be frustrating.
R and RStudio
Best for: statistics, research and academic projects.
R was built for statistical work, and RStudio Desktop gives it a friendly workspace. It produces excellent charts and suits research-heavy programmes. Many business teams lean towards Python and SQL, so R is the more specialised choice.
SQL with SQLite, MySQL or PostgreSQL
Best for: pulling data out of databases.
Company data usually lives in databases, and SQL is the language you use to ask it questions. SQL for beginners is friendlier than it sounds: SQLite needs no server setup, and a query like "total revenue by city last quarter" is a classic first exercise. SQL retrieves and summarises data but doesn't draw dashboards, so pair it with Power BI or Looker Studio.
No-Code and Data Cleaning Tools
KNIME Analytics Platform
Best for: automated workflows without coding.
KNIME lets you drag and connect blocks (called nodes) to import, clean, analyse, and export data. Visual thinkers like it. The interface looks busy on day one, so give it a weekend before judging it.
Orange Data Mining
Best for: understanding analytics concepts visually.
Orange lets you try clustering, classification, and regression by dragging widgets and watching the results update. That helps students meet the theory for the first time, though it isn't built for large professional projects.
OpenRefine
Best for: cleaning messy data.
Real data is messy. One column might list "Gurgaon", "Gurugram," and "gurugram " (with a stray space) as three different cities. OpenRefine spots similar entries and merges them in a few clicks. Among data cleaning tools, it is one of the easiest to pick up, but it only cleans, so you'll need another tool for analysis and charts.
Free Tools for Data Analytics Compared at a Glance
| Tool |
Best for |
Coding |
Difficulty |
Main catch |
| Google Sheets / Excel for the web |
Pivot tables, basics |
No |
Easy |
Slows on big files |
| Power BI Desktop |
Dashboards |
No |
Easy–Moderate |
Sharing needs a paid licence |
| Looker Studio |
Shareable reports |
No |
Easy |
Limited heavy modelling |
| Tableau Public |
Portfolio visuals |
No |
Moderate |
All work is public |
| Python (Jupyter/Colab) |
Automation, advanced analysis |
Yes |
Moderate–Hard |
Steep learning curve |
| R and RStudio |
Statistics, research |
Yes |
Moderate–Hard |
Narrower business use |
| SQL (SQLite/MySQL/PostgreSQL) |
Querying databases |
Light |
Easy–Moderate |
No dashboards on its own |
| KNIME |
Visual workflows |
No |
Moderate |
Busy interface |
| Orange |
Learning concepts |
No |
Easy |
Not for large projects |
| OpenRefine |
Data cleaning |
Minimal |
Easy |
Cleaning only |
Learning any of these on your own is possible. If you'd like a guided route through industry tools, you can explore the Data Analytics course at SPARC. Our overview of top data analytics tools is another useful read.
How to Choose Analytics Software for Beginners
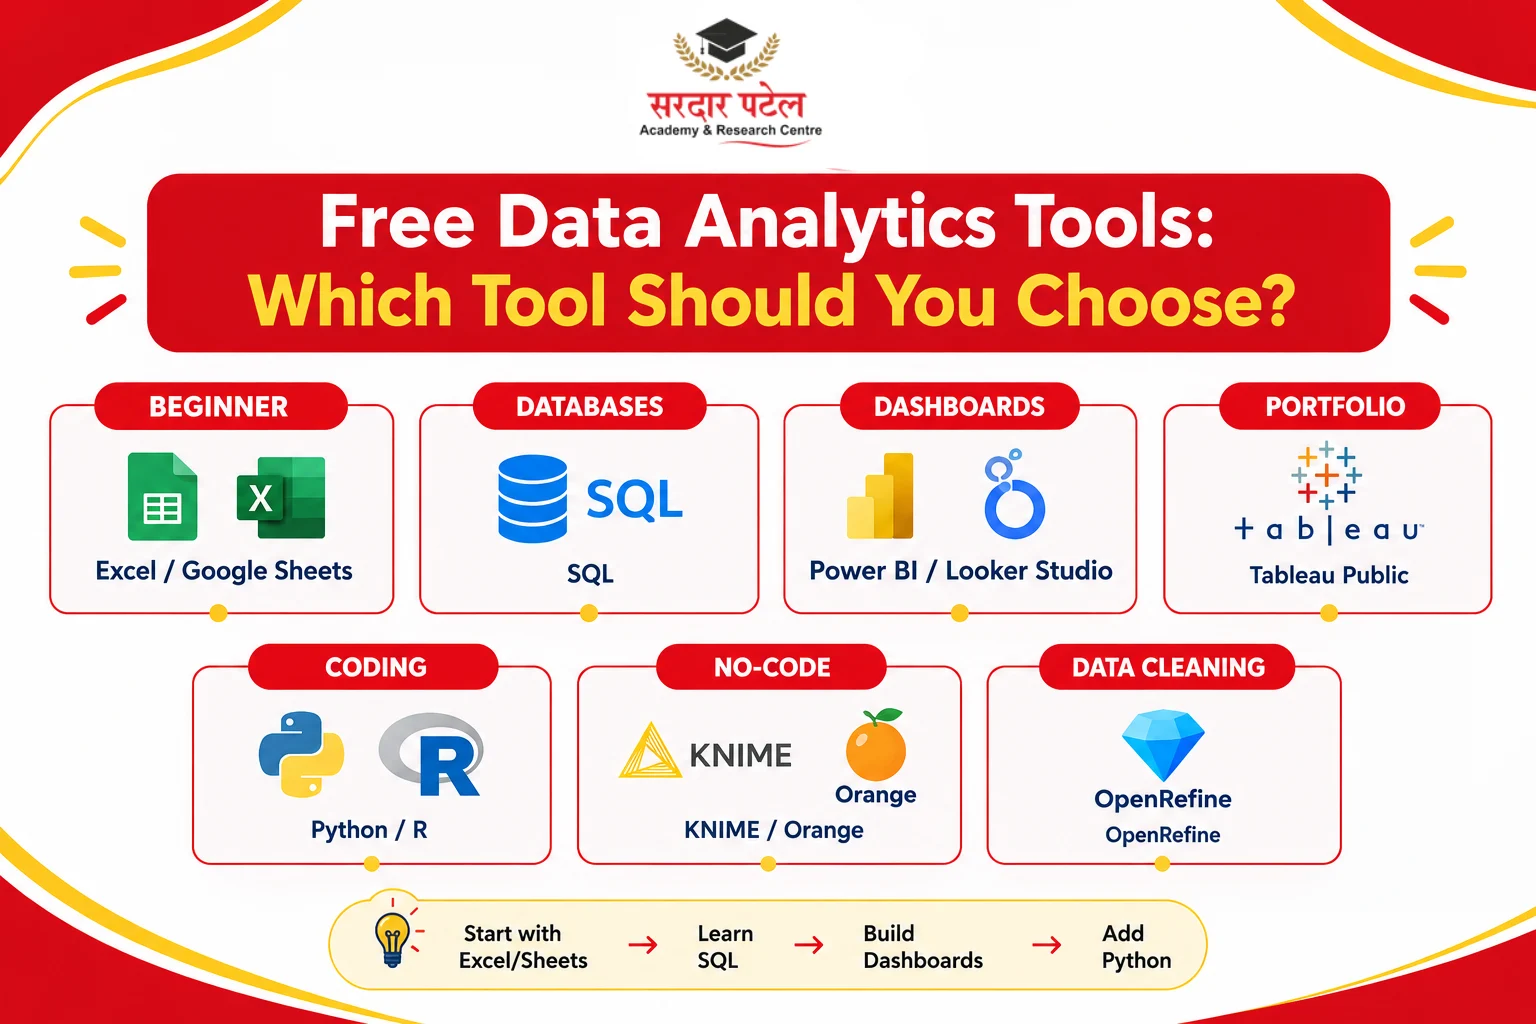
Don't rank free tools for data analytics by popularity. Rank them by what you want to do. This table is a starting point:
| If you are... |
Start with |
Then add |
| A student exploring the field |
Sheets or Excel, then SQL |
Power BI or Looker Studio, then Python |
| A professional switching careers |
Excel, SQL, Power BI |
Python for automation |
| A business owner |
Sheets and Looker Studio |
Power BI if you use Windows |
Then check your device (Power BI Desktop won't install on a Mac) and open ten analyst job posts in Delhi, Noida, or Gurugram. The tools that repeat matter more than any "top tools" list. Commit to one tool for a month and finish a small project before adding another. Once you build these core skills, it helps to understand the career scope, skills, and salaries you can expect in data analytics.
Build Your First Dashboard in 6 Steps
Here's a simple way to test analytics software for beginners on a real task, using Looker Studio:
- Pick a public dataset. Try a CSV from data.gov.in, Kaggle (a free account is needed to download), or a sample sales file.
- Clean it in Sheets. Fix headers, remove duplicates, and make sure dates are formatted as dates.
- Connect it. Create a new Looker Studio report and choose Google Sheets as the data source.
- Add key numbers. Use scorecards for totals such as revenue or number of orders.
- Add two charts. A time-series chart shows trends; a bar chart compares categories. Add one filter.
- Check and share. Compare a few numbers with your sheet, add a clear title, then share the link.
For a business-focused version of this exercise, try our KPI dashboard tutorial.
A 12-Week Plan for Beginners
These free tools for data analytics work best when you learn them in layers:
- Weeks 1–4: Spreadsheets and basic statistics: averages, percentages, distributions.
- Weeks 5–8: SQL, then Power BI or Looker Studio.
- Weeks 9–12: Python basics and one portfolio project.
If you work full-time, stretch the plan over 16 to 20 weeks. A slower pace still works, as long as you keep building. For a structured approach to learning these skills, see our Data Analytics Learning Guide. 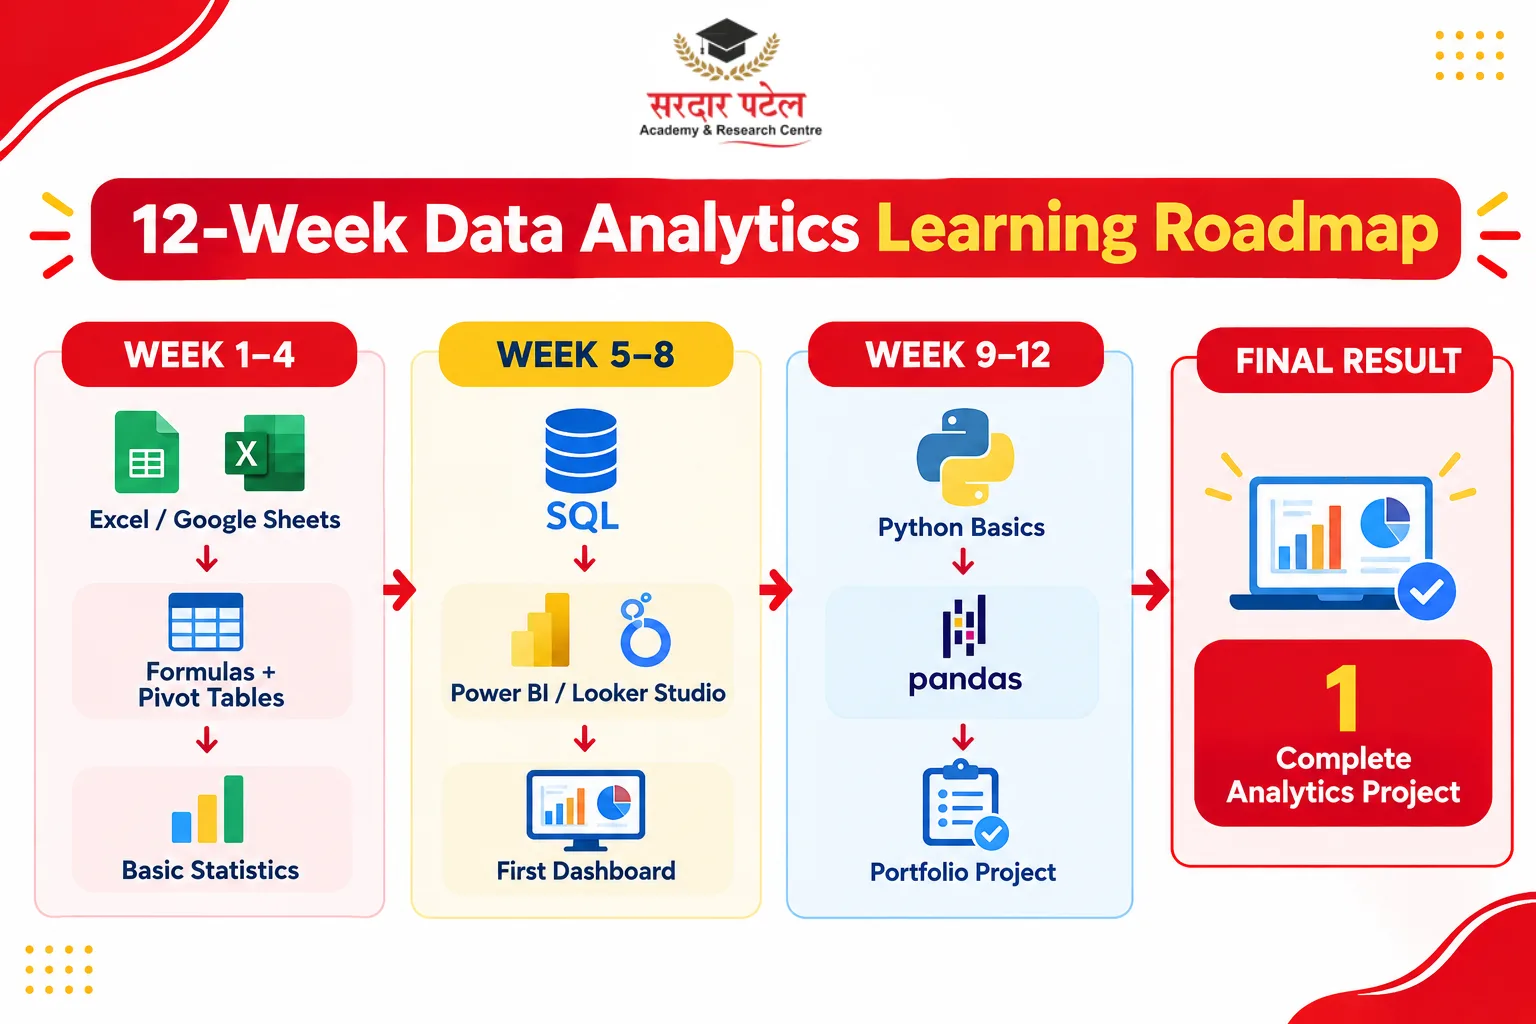
Practise on Local Data in Delhi NCR
Delhi NCR employers range from IT services and start-ups to retail, logistics, and e-commerce, so analysts here handle sales, customer, and operations data. Practise these free tools for data analytics on similar material. Understanding the changing demand for these skills can also help beginners plan their career path. Read our guide to the Future of Data Analytics Jobs in India.
- Air quality trends: public readings for Delhi are published by government agencies such as CPCB. Chart seasonal patterns in Looker Studio.
- Messy city names: build a fake customer list with Gurgaon/Gurugram and Noida/Greater Noida variants, then clean it in OpenRefine.
- A local shop tracker: log daily sales in Sheets and find the best day of the week with a pivot table.
Common Mistakes Beginners Make (and Tips That Help)
Mistakes to avoid
- Collecting tools like trophies. Installing six free data analytics tools and mastering none is the classic trap.
- Skipping cleaning. Dirty data produces confident but wrong answers.
- Publishing sensitive data. Public platforms are for public data only.
- Learning only by watching. Rebuild a dashboard from scratch instead.
- Trusting AI blindly. Assistants can explain a formula or a Python error, but you must judge the output. We explore this in how ChatGPT is changing analytics careers. You can also learn how AI is changing the tools and workflows used in modern data analytics in our guide to AI in Data Analytics.
Tips that save time
- Keep an untouched copy of the raw data before cleaning.
- Check one total by hand to confirm your chart is right.
- Put a one-line takeaway under each chart. A chart with no "so what" is decoration.
- Write down your steps. Explaining a project simply is a core data analyst skill, and interviewers ask for it.
Conclusion: Start Small, Build One Real Project
The best free tools for data analytics won't make you an analyst overnight, but they remove the biggest excuse: cost. Start with a spreadsheet, add SQL, and build your first dashboard in Power BI or Looker Studio. Keep Python for when the basics feel natural.
If you'd like guidance instead of working it out alone, see how SPARC's Data Analytics course helps you learn industry tools such as Excel, SQL, Python, Power BI, and Tableau in a structured way. Free tools get you started, and a clear path helps you keep going.
SPARC – Sardar Patel Academy & Research Centre
Computer education and training institute, GTB Nagar, North Campus, Delhi
FAQs
Start with a spreadsheet, add SQL, then pick one dashboard tool, either Power BI Desktop or Looker Studio. That order covers most beginner needs. Python can wait until you hit the limits of the first three. If you'd rather avoid code, KNIME and Orange are worth a look.
Yes. The software is free, and public datasets and documentation are plentiful. The hard part is structure: what to learn in which order, and who reviews your work. Many learners pair free tools with a guided course.
Google Sheets, Excel for the web, Looker Studio, Power BI Desktop, Tableau Public, KNIME, and Orange all work through menus or drag-and-drop. You will benefit from learning SQL later, but you can produce useful analysis without writing code.
Most beginners should start with Excel or Sheets. You'll learn data structure, formulas and charts quickly, and those ideas carry over to Python. Move to Python when you hit real limits, such as huge files or repetitive manual work.
They're a solid foundation, and job posts in your target city will show how often each tool is requested. Employers also look for problem-solving, clear communication, and proof of work, so build two or three portfolio projects.
Yes, Power BI Desktop is free to download and build reports with on Windows. Publishing and sharing with others generally needs a paid licence, and Microsoft's terms can change, so check its licensing page first.