+91 9312966129
 sparc.enquiry01@gmail.com


Latest Data Analytics Trends in 2026
Discover the top data analytics trends 2026 has brought — from AI-assisted tools to real-time dashboards — with practical tips for every career stage.
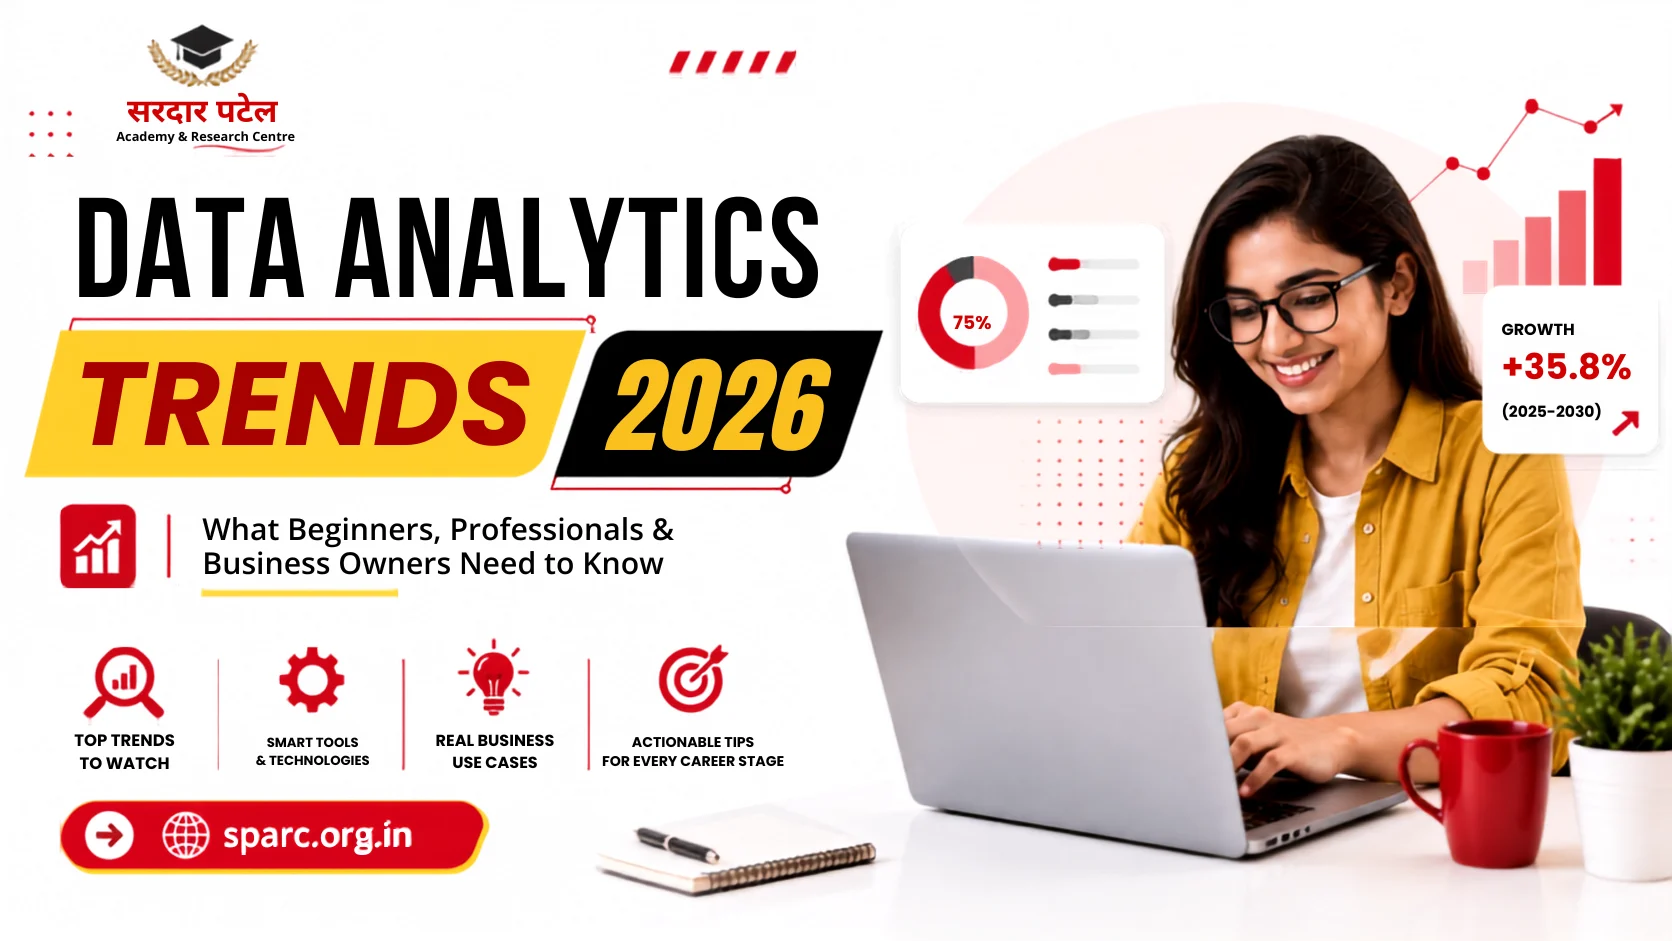
Table of Contents
- Why These Trends Matter More Than Ever
- The Key Data Analytics Trends Shaping 2026
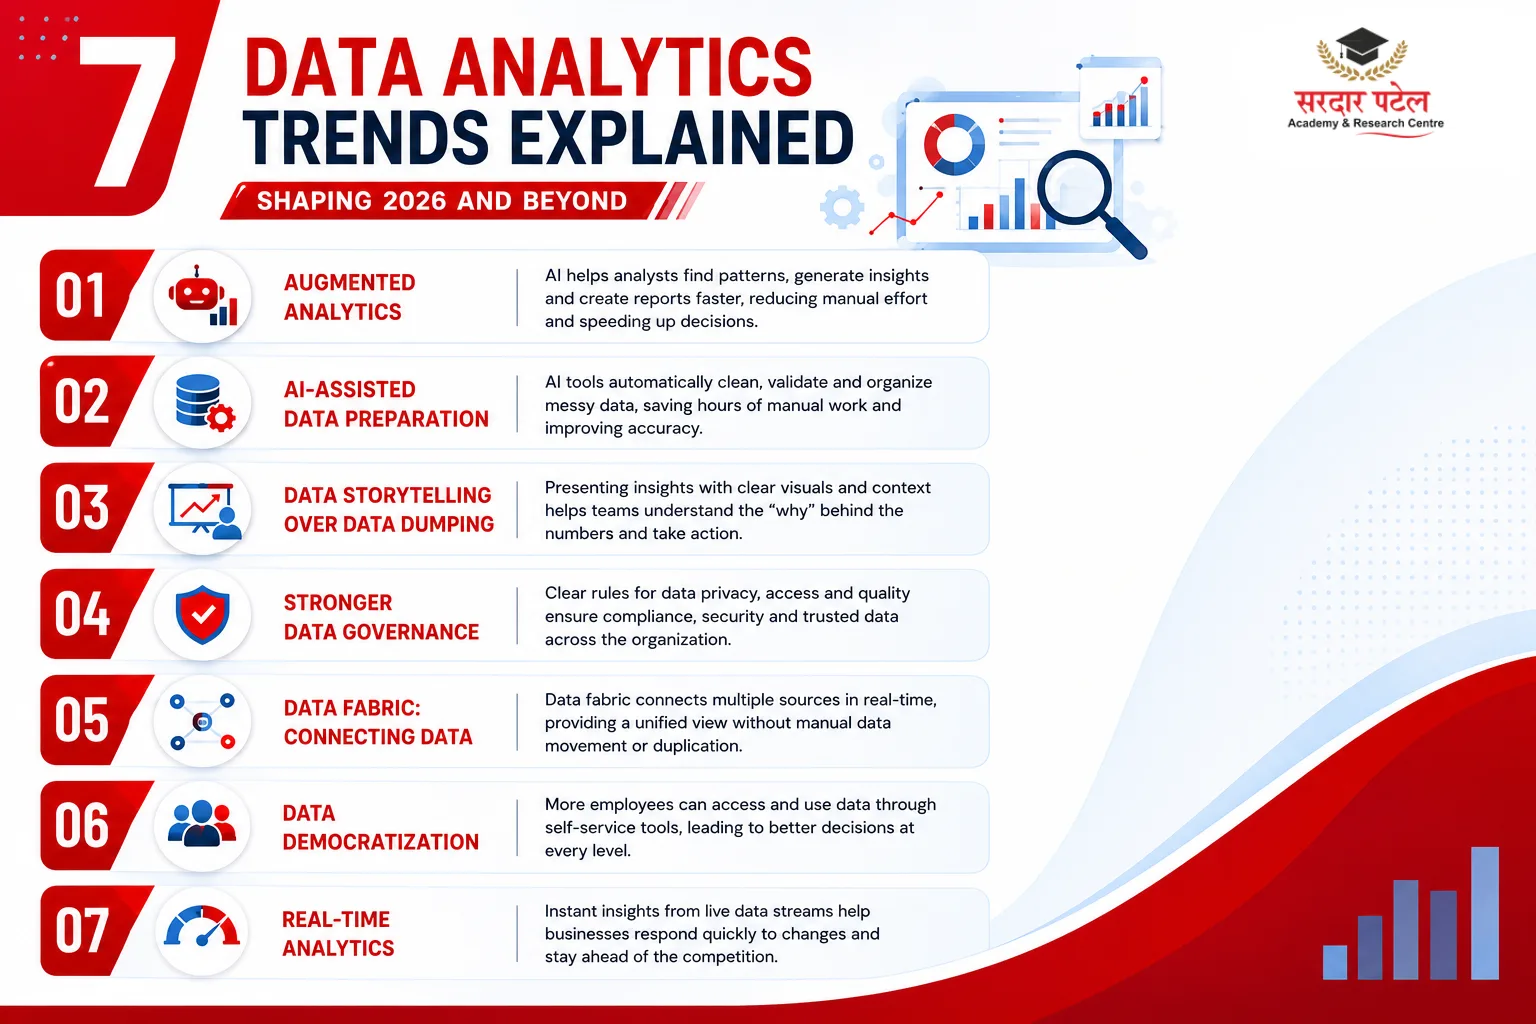
- 1. Augmented Analytics Is Becoming Standard
- 2. AI-Assisted Data Preparation
- 3. Data Storytelling Over Data Dumping
- 4. Stronger Data Governance
- 5. Data Fabric: Connecting Scattered Data
- 6. Data Democratisation
- 7. Real-Time Analytics
- Trends at a Glance
- Tools and Skills Worth Learning Right Now
- Real Business Scenarios Where These Trends Apply
- Beyond that example, here's where these trends show up daily across industries:
- Advantages of Following These Trends
- Challenges to Be Aware Of
- Common Mistakes to Avoid
- Best Practices for Working with Data in 2026
- How to Start Building These Skills Today
- Conclusion
A small retail business owner in Ahmedabad once told me she spent three days every month manually copying sales numbers from her billing software into Excel just to figure out which products sold best. By the time she got her answer, the season had already changed. That story stuck with me because it shows exactly why data analytics matters — not as a buzzword, but as a way to make decisions before it's too late.
I've spent years working with data teams, training students, and helping business owners understand their numbers. Every year, the tools and expectations shift a little more, and this year is no exception. Whether you're a student picking a career path, a professional updating your skills, or a business owner trying to make sense of your data, this guide explains the Data Analytics Trends 2026 that are changing the way people work with data and what you can do to stay ahead.
By the end, you'll understand the biggest shifts in the field, which tools are worth learning, real examples of how businesses use analytics, and the mistakes that trip people up most often. If you're also thinking about where this career path is headed, it's worth pairing this with a closer look at the future of data analytics jobs in India, since the two topics overlap more than most people expect.
Why These Trends Matter More Than Ever
Data isn't scarce anymore. Every click, transaction, and sensor reading generates it. The real challenge has moved from "how do we collect data" to "how do we make sense of it fast enough to act." That shift is exactly what's driving the Data Analytics Trends 2026, as businesses focus on making faster and smarter decisions using real-time insights.
Companies that adapt quickly gain a real edge. Those that don't end up making decisions based on outdated reports, the same way our retail business owner did with her three-day-old sales numbers.
This isn't just anecdotal. India's data analytics market is projected to grow at a compound annual rate of roughly 35.8% between 2025 and 2030, according to industry market-sizing research — one of the fastest growth rates of any tech services segment in the country. For beginners considering this field, understanding who can start a career in data analytics can make the learning journey much clearer. Demand for people who can actually work with that data is climbing just as fast: NASSCOM estimates that demand for data science and AI professionals in India will cross one million by 2026.
The Key Data Analytics Trends Shaping 2026
1. Augmented Analytics Is Becoming Standard
Augmented analytics means using AI to help humans analyse data faster: spotting patterns, suggesting insights, and automatically drafting basic reports. Instead of manually building every chart, analysts now review AI-generated suggestions and refine them.
Practical example: A marketing analyst working in Power BI can ask a built-in AI assistant which region had the biggest drop in conversions last month and get an instant visual breakdown, instead of manually filtering pivot tables.
This isn't a marginal shift — Gartner projects that by 2027, roughly three-quarters of new analytics content will be automatically shaped by generative AI to connect directly to business context and actions, rather than sitting as a static report someone has to interpret manually.
This doesn't replace analysts. It removes repetitive grunt work so people can focus on interpreting results and making recommendations. This shift is also part of a bigger conversation worth having separately: which AI vs Data Analytics Career Comparison, and how something like ChatGPT is changing analytics careers — a measurable shift, not just anecdotal: enterprise use of generative AI tools and APIs has gone from under 5% of organisations in 2023 to a projected 80%-plus by the end of 2026, per Gartner. That's the pace of change reshaping what "knowing analytics tools" means for anyone entering the field today.
2. AI-Assisted Data Preparation
Cleaning messy data used to eat up most of an analyst's week. Now, AI-assisted tools can detect duplicates, fix formatting issues, and flag missing values automatically.
Python Example
import pandas as pd
df = pd.read_csv("sales_data.csv")
df.drop_duplicates(inplace=True)
df.fillna(df.mean(numeric_only=True), inplace=True)
This removes duplicate rows and fills missing numeric values with column averages, a basic version of what modern data prep tools now handle automatically at scale.
3. Data Storytelling Over Data Dumping
Numbers alone don't convince anyone. The trend now is toward data storytelling: presenting insights in a way that connects to a business goal, not just a spreadsheet full of figures.
Real scenario: Instead of showing a finance team twelve months of raw expense data, a good analyst builds one simple line chart highlighting the three months where costs spiked, then explains why, perhaps a supplier price increase or a seasonal demand shift.
4. Stronger Data Governance
With tighter privacy regulations, companies are setting clear rules about who can access data, how it's stored, and how it's used. Data governance and management. This isn't just an IT concern anymore; analysts need to understand these basics too.
Practical tip: When working with customer data in Excel or SQL, mask personal details like names and phone numbers before sharing files across teams.
5. Data Fabric: Connecting Scattered Data
Most businesses have data spread across a CRM, an accounting tool, and a marketing platform, each disconnected from the others. Data fabric connects these sources so teams can pull information from one place instead of manually merging exports.
A logistics manager who needs delivery data from one system and inventory data from another benefits directly here, since the systems can now talk to each other automatically.
6. Data Democratisation
Analytics is no longer just for the data team. More companies are training non-technical employees to read dashboards and pull their own basic reports.
Example: A sales manager with no coding background can use a Power BI dashboard to filter results by region and product without asking an analyst every time.
7. Real-Time Analytics
Waiting for a weekly report isn't good enough in many industries anymore. Real-time dashboards update as new data arrives, letting teams react within minutes instead of days.
Example: An e-commerce team running a flash sale can watch live conversion rates and adjust ad spend mid-campaign, rather than finding out results the next morning.
This is backed by a clear infrastructure shift, not just preference: Gartner expects adoption of real-time data streaming for AI-driven systems to jump past 60% by 2028, up from under 15% in 2025 — meaning the "wait for tomorrow's report" model is losing ground fast across industries, not just in flashy use cases like flash sales.
Trends at a Glance
Tools and Skills Worth Learning Right Now
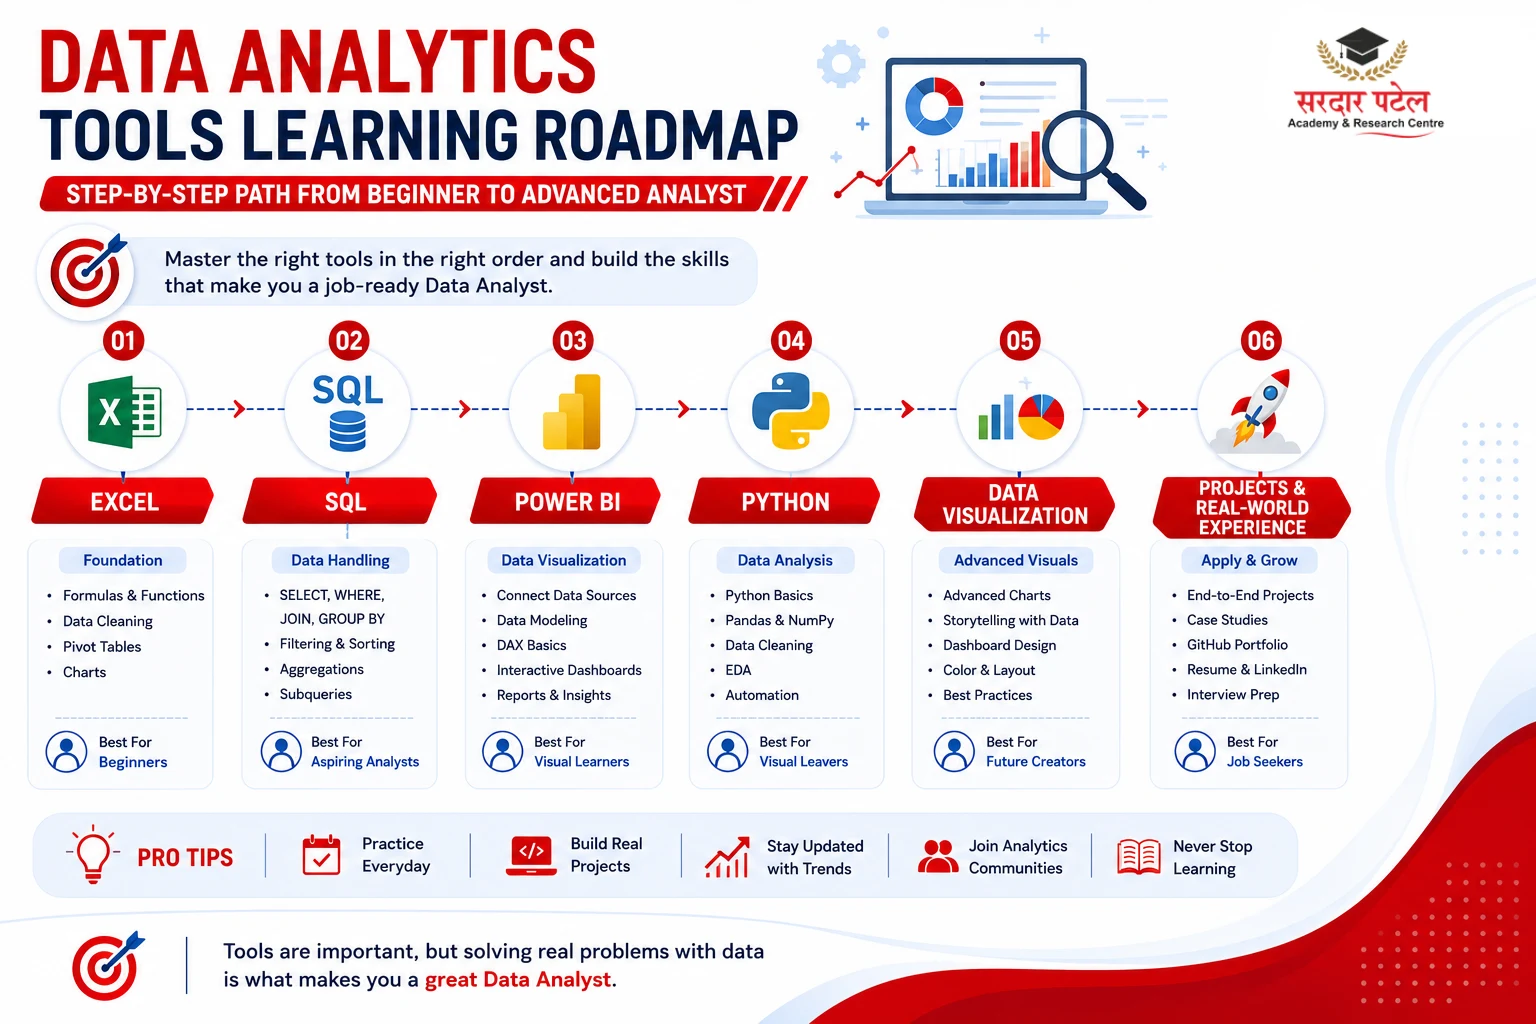
To make the most of the Data Analytics Trends 2026, professionals should focus on learning practical tools that are widely used across industries. The right combination of technical and visualisation skills can help you stay competitive in today's job market.
A simple SQL example for finding top-selling products:
SELECT product_name, SUM(quantity_sold) AS total_sold
FROM sales
GROUP BY product_name
ORDER BY total_sold DESC
LIMIT 5;
This kind of query answers a real business question in seconds, something that used to take hours of manual sorting in spreadsheets.
Real Business Scenarios Where These Trends Apply
I once worked with a small logistics operator who tracked fuel costs and delivery delays in separate Excel sheets updated by different staff. Once we connected both into a single dashboard, the owner spotted within a week that late-evening deliveries were quietly driving up fuel costs. That single insight changed how routes were scheduled.
Beyond that example, here's where these trends show up daily across industries:
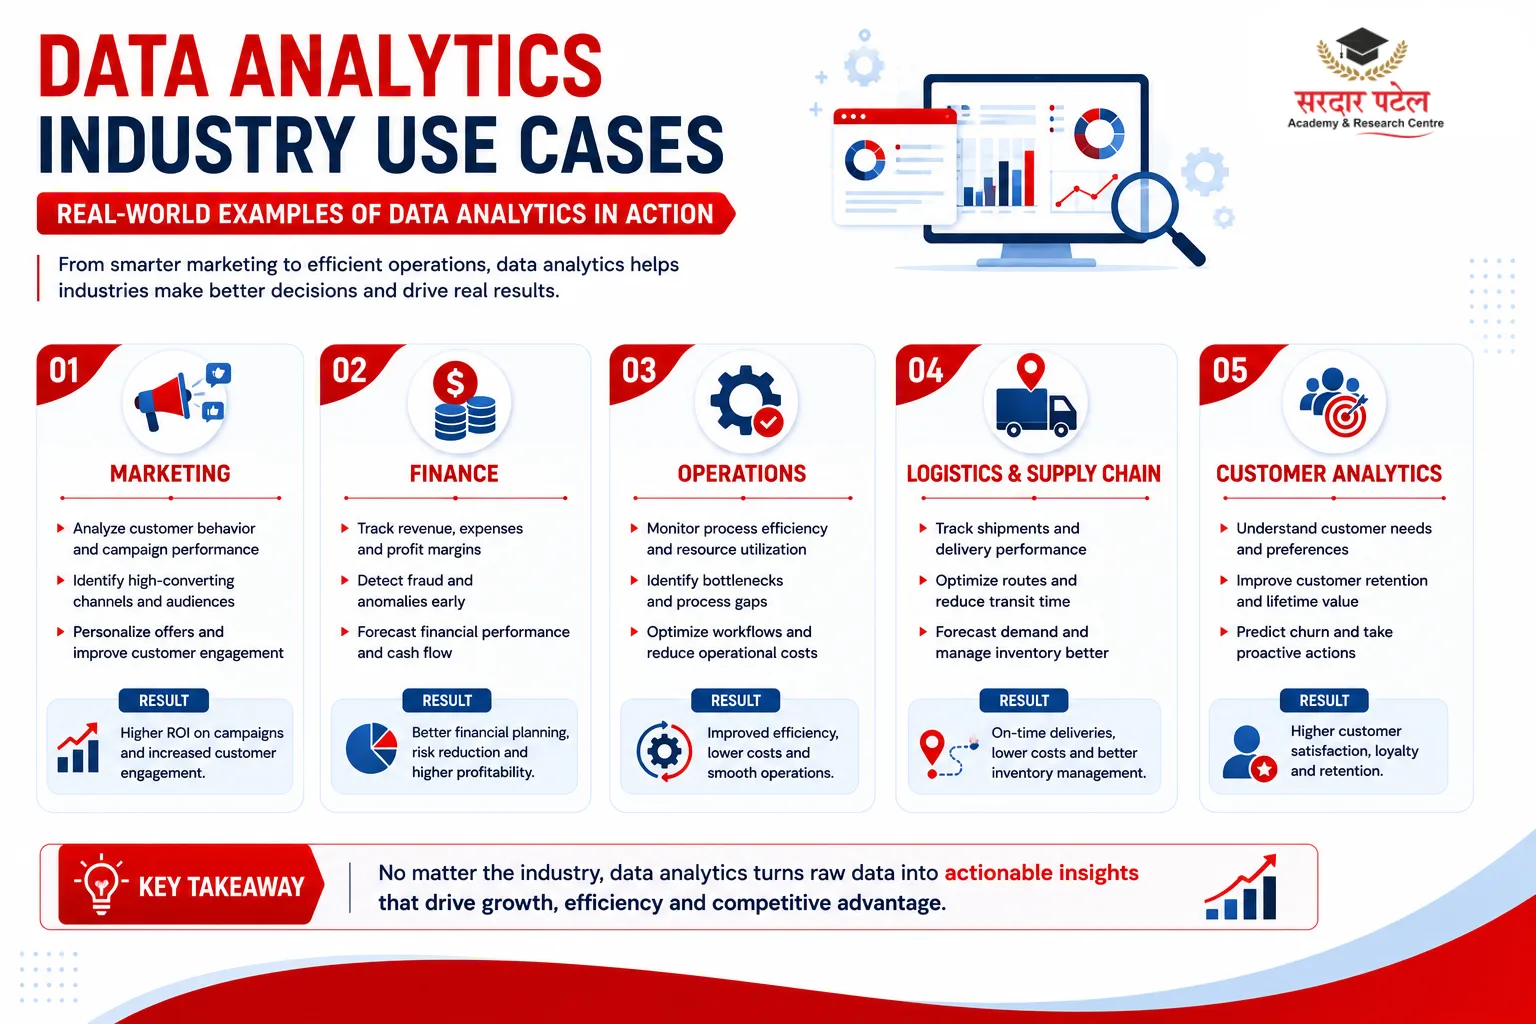
- Marketing analytics: Tracking which campaigns bring paying customers, not just clicks, using dashboard funnels.
- Operations optimisation: Using real-time inventory data to prevent stockouts during high-demand periods.
- Financial forecasting: Building simple forecasting models in Excel or Python to estimate next quarter's revenue from historical trends.
- Customer insights: Segmenting customers by purchase behaviour instead of sending the same offer to everyone.
Advantages of Following These Trends
- Faster decisions with real-time data instead of outdated reports
- Less manual work, freeing analysts to focus on strategy
- Better collaboration as more people across a company can access and understand data
- Improved accuracy through automated cleaning and governance checks
Challenges to Be Aware Of
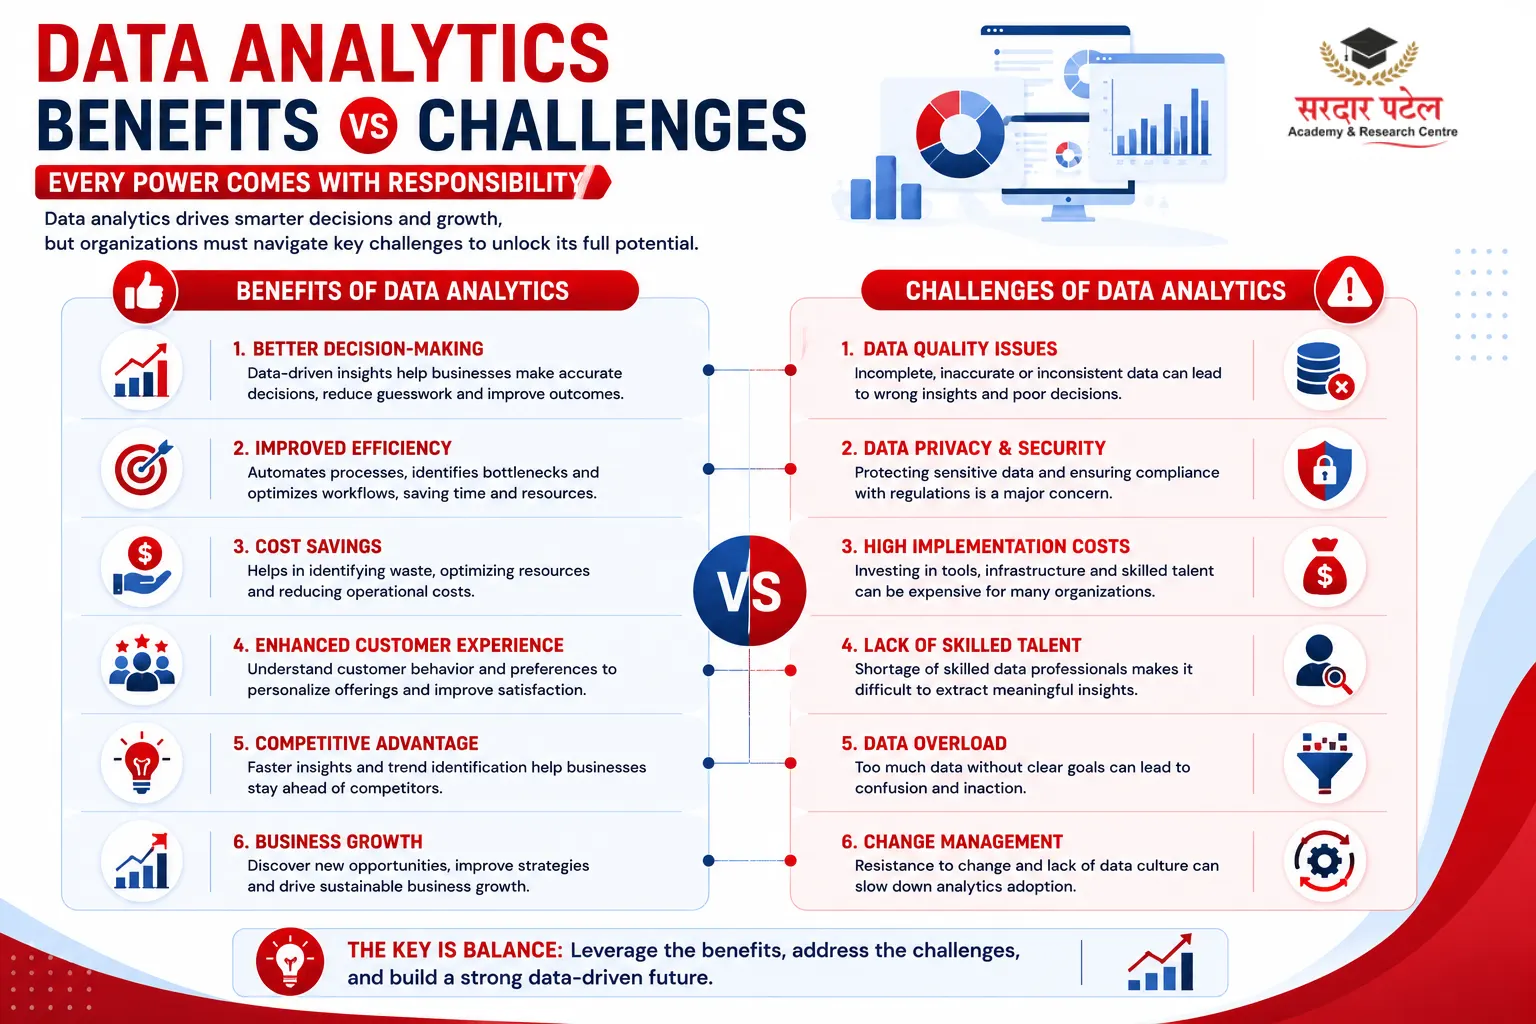
- Tool overload: New AI features can tempt teams into learning tools that don't fit their actual needs.
- Privacy risks: Democratizing data access without proper governance can expose sensitive information.
- Skill gaps: Many professionals still rely on Excel-only skills, limiting their ability to handle larger datasets.
- Over-reliance on AI: Augmented analytics tools help, but blindly trusting AI-generated insights without human judgment leads to poor decisions.
Common Mistakes to Avoid
- Skipping data validation — always double-check automated outputs before presenting them.
- Building dashboards without a clear question — a dashboard should answer something specific.
- Ignoring context — a sales spike might just be one bulk order, not a real trend.
- Overcomplicating visuals — simple bar and line charts often work better than fancy ones.
Best Practices for Working with Data in 2026
To keep up with the Data Analytics Trends 2026, start by learning SQL and Python basics, even if Excel is your primary tool. These skills will help you work with larger datasets and modern analytics platforms.
Practice explaining findings in plain language to someone outside your team. If they don't get it, simplify further.
Set up basic governance habits early, even in small teams. It saves headaches later.
Use real-time dashboards for urgent decisions, but rely on deeper analysis for long-term strategy.
This kind of practical, hands-on learning is exactly what programs like SPARC (Sardar Patel Academy & Research Centre) focus on, working with real datasets and tools like Excel, SQL, Python, and Power BI rather than theory alone.
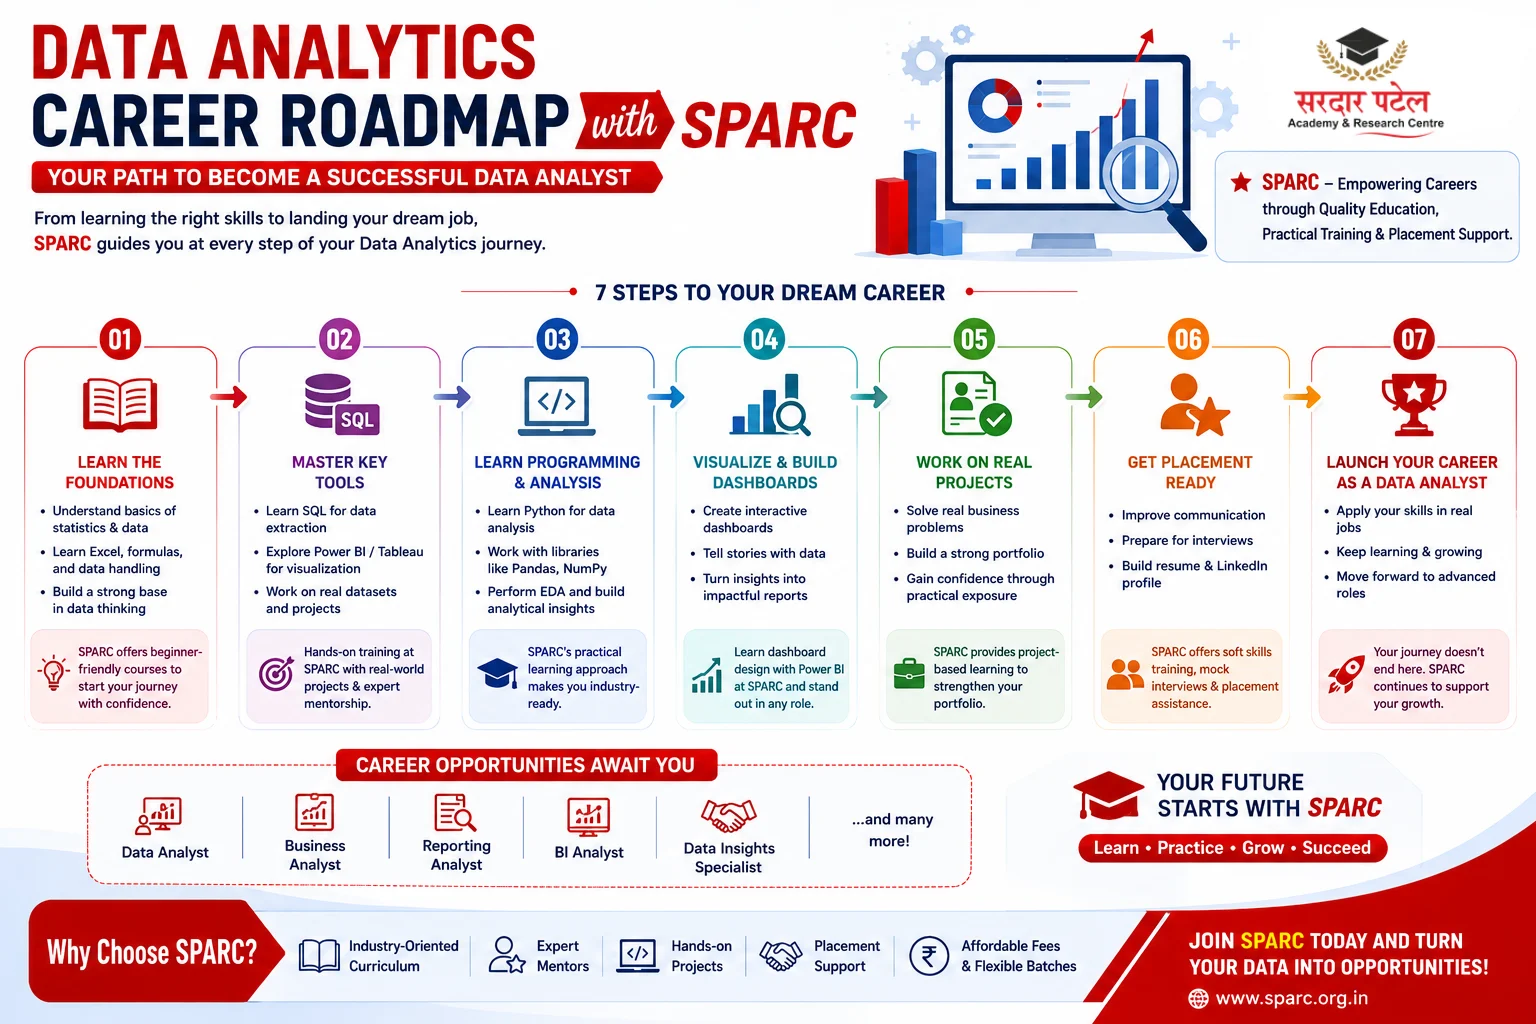
How to Start Building These Skills Today
- Pick one tool to start with: Excel if you're a complete beginner, SQL if you already understand spreadsheets.
- Work with a real dataset, even something small like your own monthly expenses.
- Build one simple dashboard or report each week to practice data storytelling.
- Learn basic Python for automating repetitive cleaning tasks. If you are looking for a structured way to build these skills, follow a practical roadmap for learning data analytics.
- Consider a structured, career-focused course rather than scattered tutorials if you want guided learning and placement support.
Conclusion
The biggest shift in the Data Analytics Trends 2026 isn't just about new tools—it's about a smarter way of working with data. Businesses now need faster insights, cleaner data, and better decision-making to stay competitive.
If you're serious about building real, job-ready skills in this space, SPARC's data analytics course offers structured, project-based training with placement support. You can also start your Data Analytics journey today with SPARC and learn Excel, SQL, Python, and Power BI through live projects.
FAQs
The biggest Data Analytics Trends 2026 include augmented analytics, AI-assisted data preparation, real-time dashboards, stronger data governance, and data democratization across organizations.
Start with Excel for basic calculations, then move to SQL for querying data. Power BI and Python are good next steps once the basics feel comfortable.
Not necessarily at the start. Many entry-level roles rely on Excel and dashboard tools like Power BI. Learning SQL and basic Python does expand career options significantly.
Traditional reporting relies on daily or weekly summaries, while real-time analytics updates dashboards continuously, letting teams react as changes happen.
Yes. As more businesses rely on data to make decisions, demand for people who can clean, analyze, and clearly explain data continues to grow across industries.
Structured programs, like the one offered by SPARC, combine tool training with real project work and placement support, helping learners move from theory to actual job readiness.