+91 9312966129
 sparc.enquiry01@gmail.com


Power BI vs Tableau Comparison
Power BI vs Tableau in 2026: Compare pricing, learning curve, features, AI tools, certifications, and Delhi NCR job opportunities to choose the right BI tool.

Table of Contents
- At a glance
- What are Power BI and Tableau?
- Head-to-head comparison
- Ease of learning
- Charts and visual design
- Data preparation and modeling
- Cost: what you will actually pay
- Sharing and collaboration
- Large data and speed
- AI features in 2026
- Pros and cons
- Power BI
- Tableau
- Which one fits you?
- A free third option: Looker Studio
- The Delhi NCR job market
- Run a 15-minute tally:
- Certifications
- How to choose in 5 steps
- Free ways to learn
- Common mistakes and practical tips
- Mistakes to avoid
- Practical tips
- Conclusion: pick a starting point, then build
You have shortlisted two dashboard tools, and every video, forum thread, and friend has a different opinion. One person calls Microsoft's tool the obvious choice. Another says serious analysts only use Tableau. Both have a point, which is exactly why the decision feels harder than it should.
Power BI vs Tableau is one of the most common comparisons for students, working professionals, and aspiring data analysts in 2026. This guide compares the two in plain language: prices, learning curve, visuals, data handling, AI features, certifications, and the Delhi NCR job market. Pricing and license details were reviewed in September 2026 against vendor pages and recent pricing guides.
It is written for students, working professionals, and business owners. Pricing and license details were reviewed in September 2026 against vendor pages and recent pricing guides. Vendors change plans often, so confirm current details on the official pages linked below before you spend money. Figures the vendors do not publish plainly are marked as approximate.
Quick answer: For most beginners, Excel users, and people on a small budget, Power BI is the safer first pick. Tableau tends to win where visual flexibility and open-ended data exploration matter most. Neither is the best choice for every situation, so match the tool to your device, budget, and career goal. That is our opinion, not a rule, and the sections below explain the reasoning.
At a glance
| Feature |
Power BI |
Tableau |
| Made by |
Microsoft |
Salesforce |
| Free way to practice |
Power BI Desktop (Windows only); sharing needs a paid license |
Desktop Free Edition (local only) or Public Edition (publishes to Tableau Public) |
| Paid seat that can build and share |
Pro: $14 per user per month |
Creator: from $75 per user per month, billed annually |
| Learning curve |
Gentle if you already use Excel |
Easy to start, deeper to master |
| Strongest at |
Business reporting, data modeling, Microsoft integration |
Visual exploration, custom charts, design control |
| Formula language |
DAX, plus Power Query for data prep |
Calculated fields and LOD expressions |
| Data prep |
Power Query, built into Power BI Desktop |
Tableau Prep Builder, a separate app included with Creator |
| Desktop app runs on |
Windows only |
Windows and Mac |
| AI assistant |
Copilot (needs paid Fabric or Premium capacity) |
Pulse, Agent, and Tableau Next (depends on edition; some sold through sales) |
| Good fit for |
Excel-heavy teams, small businesses, beginners |
Analysts who explore data, design-led teams, Salesforce users |
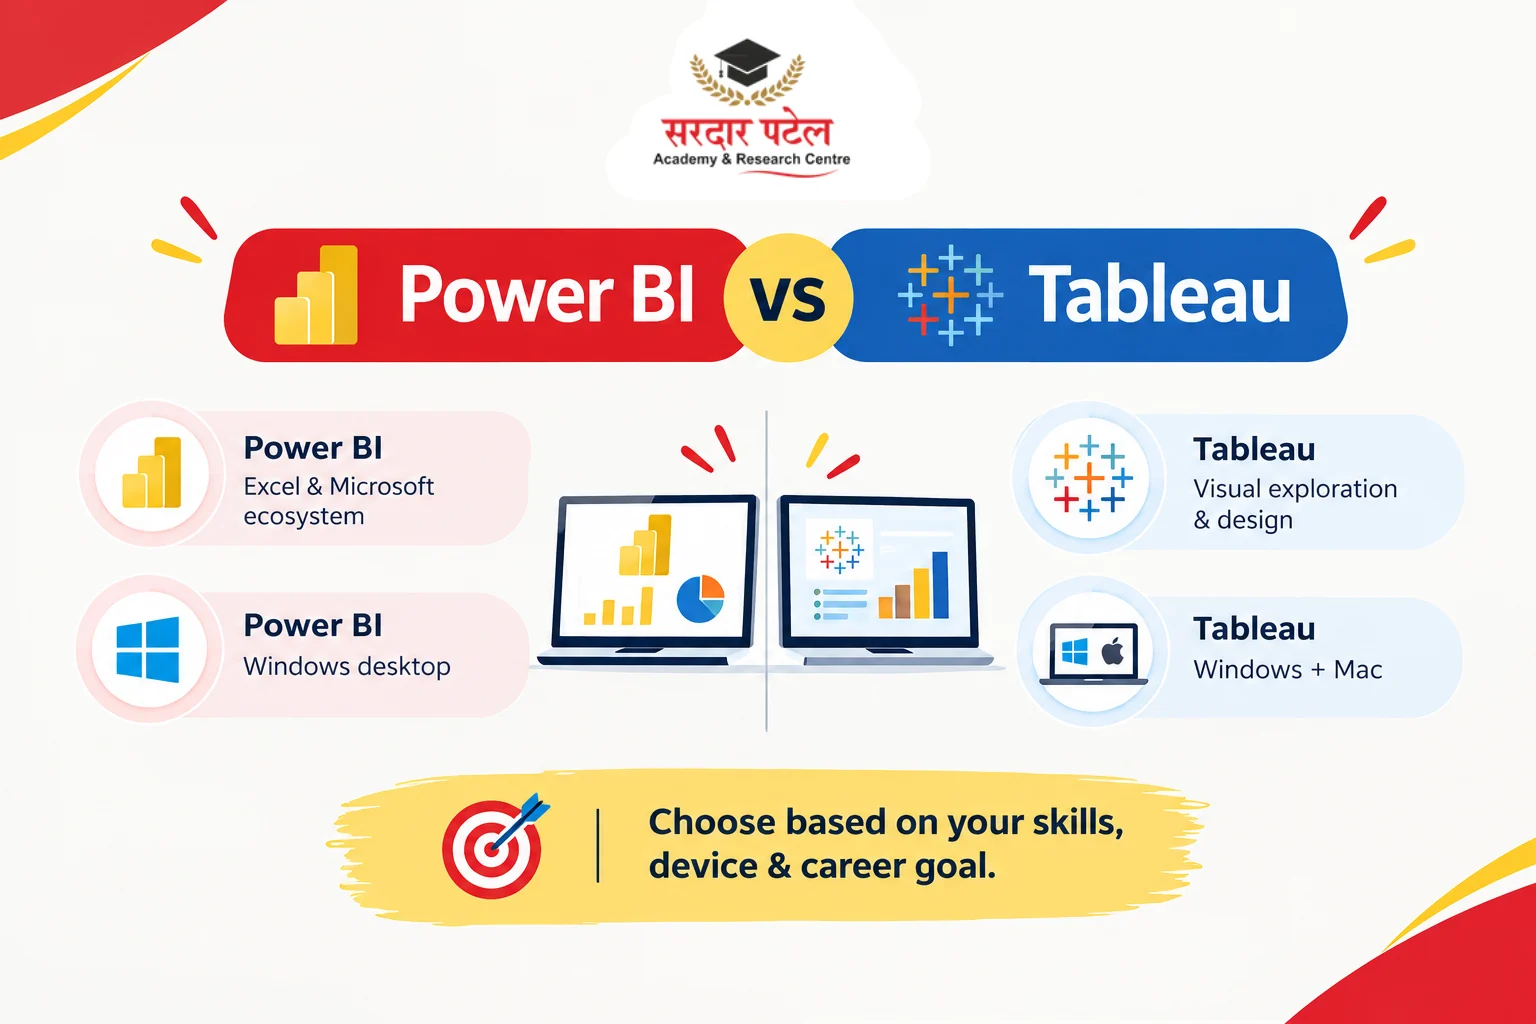
These are differences of emphasis, not a scoreboard.
What are Power BI and Tableau?
Both are business intelligence (BI) tools used in data analytics. They connect to your data, help you clean and model it, and turn it into charts and dashboards that other people can filter and explore.
Power BI is Microsoft's BI product. You build reports in Power BI Desktop, publish them to the online Power BI Service, and share them with colleagues. It fits naturally when your workplace already runs on Excel, Teams, and SharePoint.
Tableau is a data visualization platform owned by Salesforce. You drag fields onto a canvas, and the chart assembles itself, so exploring data feels closer to sketching than programming. Analysts often like it for its visual control and quick what-if exploration.
Head-to-head comparison
Ease of learning
If you are comfortable with Excel, Power BI will feel familiar within a few days. The ribbon, the formulas, and the Power Query editor resemble things Excel users already know. The harder part comes later, when you meet DAX and data modeling.
Tableau's drag-and-drop canvas is friendly too, and a first bar chart takes minutes. Depth shows up when you need level-of-detail (LOD) expressions or complex table calculations, and that is where many beginners stall.
In our experience, the split follows background: Excel users usually find Power BI gentler, while people starting from zero find both equally new.
Charts and visual design
Tableau's reputation rests on visual flexibility. Custom chart types, fine formatting, and smooth exploration are its strengths, and many designers prefer working in it.
Power BI has a marketplace of extra visuals, and in our view, its default visuals are enough for everyday sales, finance, and operations dashboards. If pixel-level design control is your priority, Tableau still has the edge.
Data preparation and modeling
Power BI includes Power Query inside the same tool, so you can clean data and build reports in one place. Relationships between tables and measures written in DAX make it strong for structured business data.
Tableau does lighter modeling in its main tool and handles heavier cleaning in Tableau Prep Builder. Prep is a separate application, but it comes bundled with the Creator license, so paying users do not buy it separately.
Many analysts also prepare data in SQL or Python before it reaches either tool. If your files are messy, learn SQL and Excel cleaning first, because these are essential data analytics tools and skills.
Cost: what you will actually pay
Microsoft raised Power BI Pro to $14 per user per month and Premium Per User to $24 from April 1, 2025. See the official Power BI pricing page.
Tableau is trickier to read. Its pricing starts at $15 per user per month on Standard and $35 on Enterprise, but that entry price belongs to the view-only Viewer seat. The seat that lets you build dashboards is Creator, which bundles Tableau Desktop and Prep Builder. Creator lists at $75 per user per month on Standard and $115 on Enterprise, billed annually. Tableau requires an annual contract; there is no monthly plan at list pricing. See Tableau's pricing page.
| Plan |
List price (USD per user per month) |
Approx. INR (before GST) |
| Power BI Desktop |
$0 |
₹0 |
| Power BI Pro |
$14 |
about ₹1,350 |
| Power BI Premium Per User |
$24 |
about ₹2,300 |
| Tableau Desktop Free or Public Edition |
$0 |
₹0 |
| Tableau Viewer (Standard) |
$15 |
about ₹1,450 |
| Tableau Creator (Standard) |
$75 |
about ₹7,200 |
| Tableau Creator (Enterprise) |
$115 |
about ₹11,000 |
Rupee figures are approximate conversions at ₹96 per US dollar (mid-September 2026). They exclude GST, which is typically added for Indian purchases, and exchange rates move daily. Treat the table as a guide, not a quote. Indian pricing may differ from US list prices, so check the India versions of the vendor pages.
For one person building and sharing dashboards, Power BI Pro costs less than a fifth of a Tableau Creator seat on Standard. Free practice works differently on each side:
- Power BI: Desktop is free on Windows. A free license lets you publish only to your own private "My workspace"; sharing with others needs a paid license (see Microsoft's license comparison). Signing up for the online service is also stricter than most learners expect: Microsoft asks for a work or school email account rather than a consumer address like Gmail, though a Microsoft 365 trial can create a work account for you.
- Tableau: There are two free desktop editions. Free Edition keeps your work on your own machine, with unlimited rows and a wide range of data sources, but it cannot publish anywhere. Public Edition is capped at 15 million rows and connects to a narrower list of sources; it can save locally or publish to Tableau Public, where everything is visible to everyone, and it is not meant for commercial use. See Tableau's edition comparison. The old one-year student license for Desktop and Prep is no longer offered; Tableau's student page now points learners to Desktop Public Edition with no renewal needed. Use open or sample data on Tableau Public, and keep private data in Free Edition.
On cost alone, the balance tilts toward Power BI for individuals and small teams.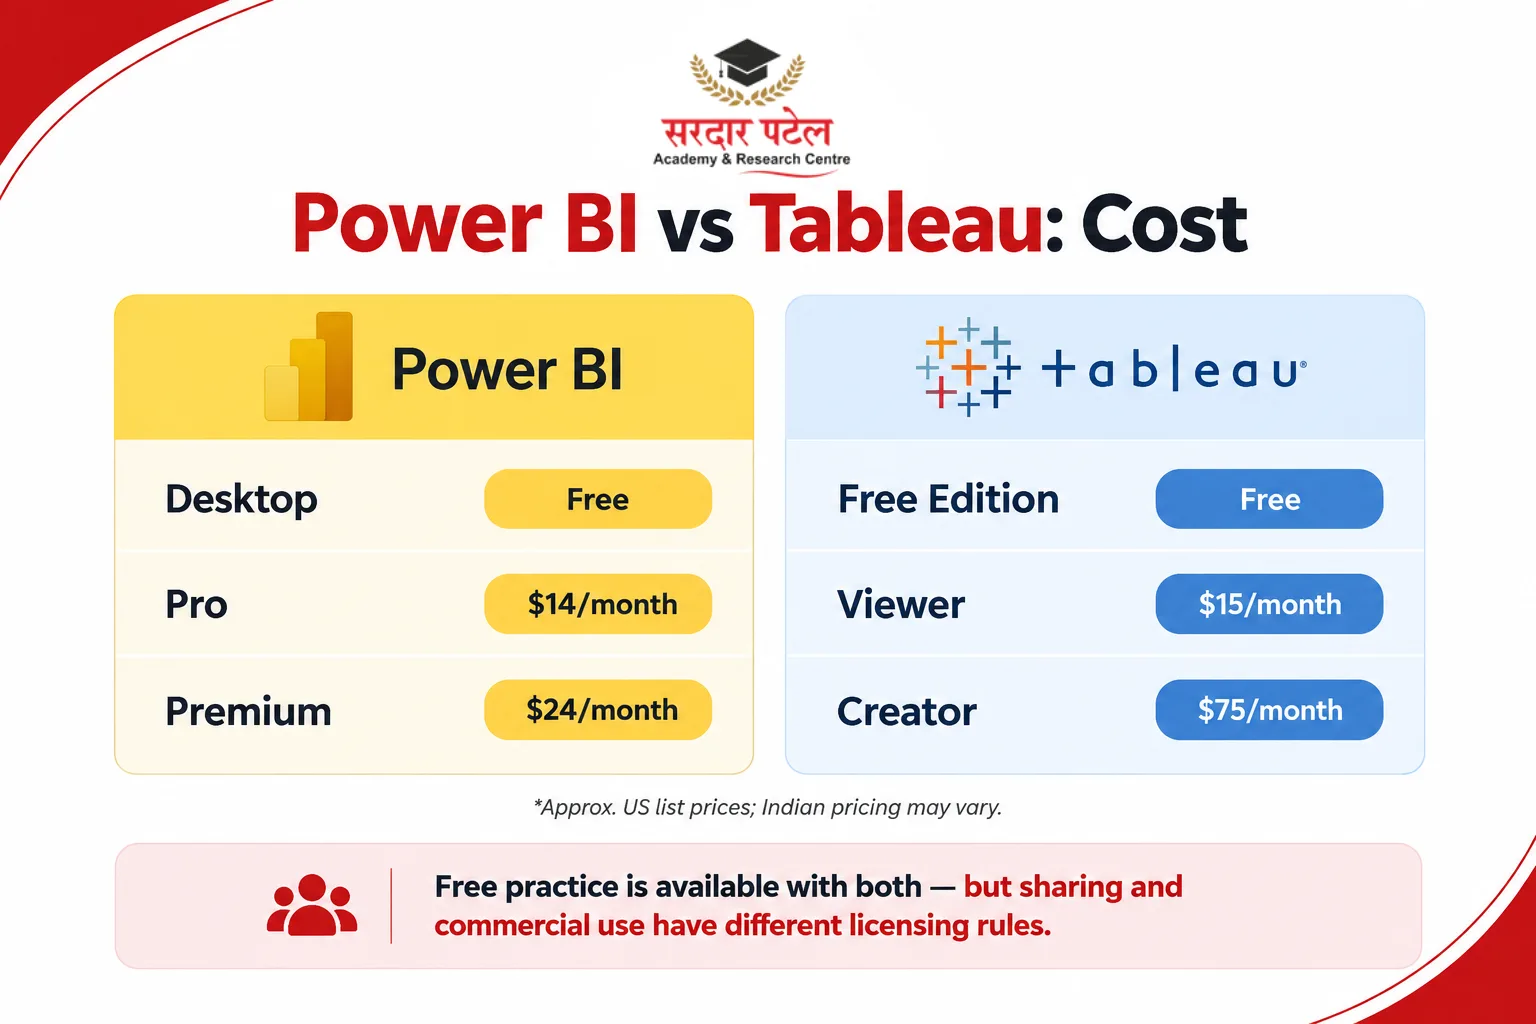
Sharing and collaboration
Power BI reports are shared through the Power BI Service, and the integration with Teams and Excel is a real advantage in Microsoft-based offices. One budgeting catch: with Pro licensing, every person who views a shared report also needs a Pro license, so team cost grows with headcount. The exception is content stored in Premium or Fabric F64-and-above capacity, where viewers with free licenses can open reports. That is usually a company-level purchase.
Tableau shares through Tableau Cloud or Tableau Server, with license roles such as Creator, Explorer, and Viewer. Viewer seats are the cheaper way to give many people access, and Tableau also offers capacity-based options through its sales team.
Both support row-level security, which lets two people open the same dashboard and see only their own region's numbers. For teams, the sharing model often decides the choice more than any chart type does.
Large data and speed
Both tools handle large datasets in two broad ways: import a compressed copy of the data, or query the source live. Power BI calls these Import and DirectQuery modes, and Tableau calls them extracts and live connections. Imported data is usually faster for dashboards, while live queries keep numbers current but depend on how fast your database responds.
Plan limits matter too. On Power BI, Pro allows up to 8 scheduled refreshes a day and a 1 GB model size, while Premium Per User allows up to 48 refreshes and models up to 100 GB (check Microsoft Learn for current limits). On Tableau's side, the free Public Edition caps analysis at 15 million rows.
Beyond plan limits, speed depends more on model design than on the brand. A page with fifteen heavy visuals will crawl in either tool. Remove unused columns, keep visuals per page reasonable, and aggregate data before loading it.
AI features in 2026
Both vendors now sell AI assistants, and licensing is where beginners get surprised.
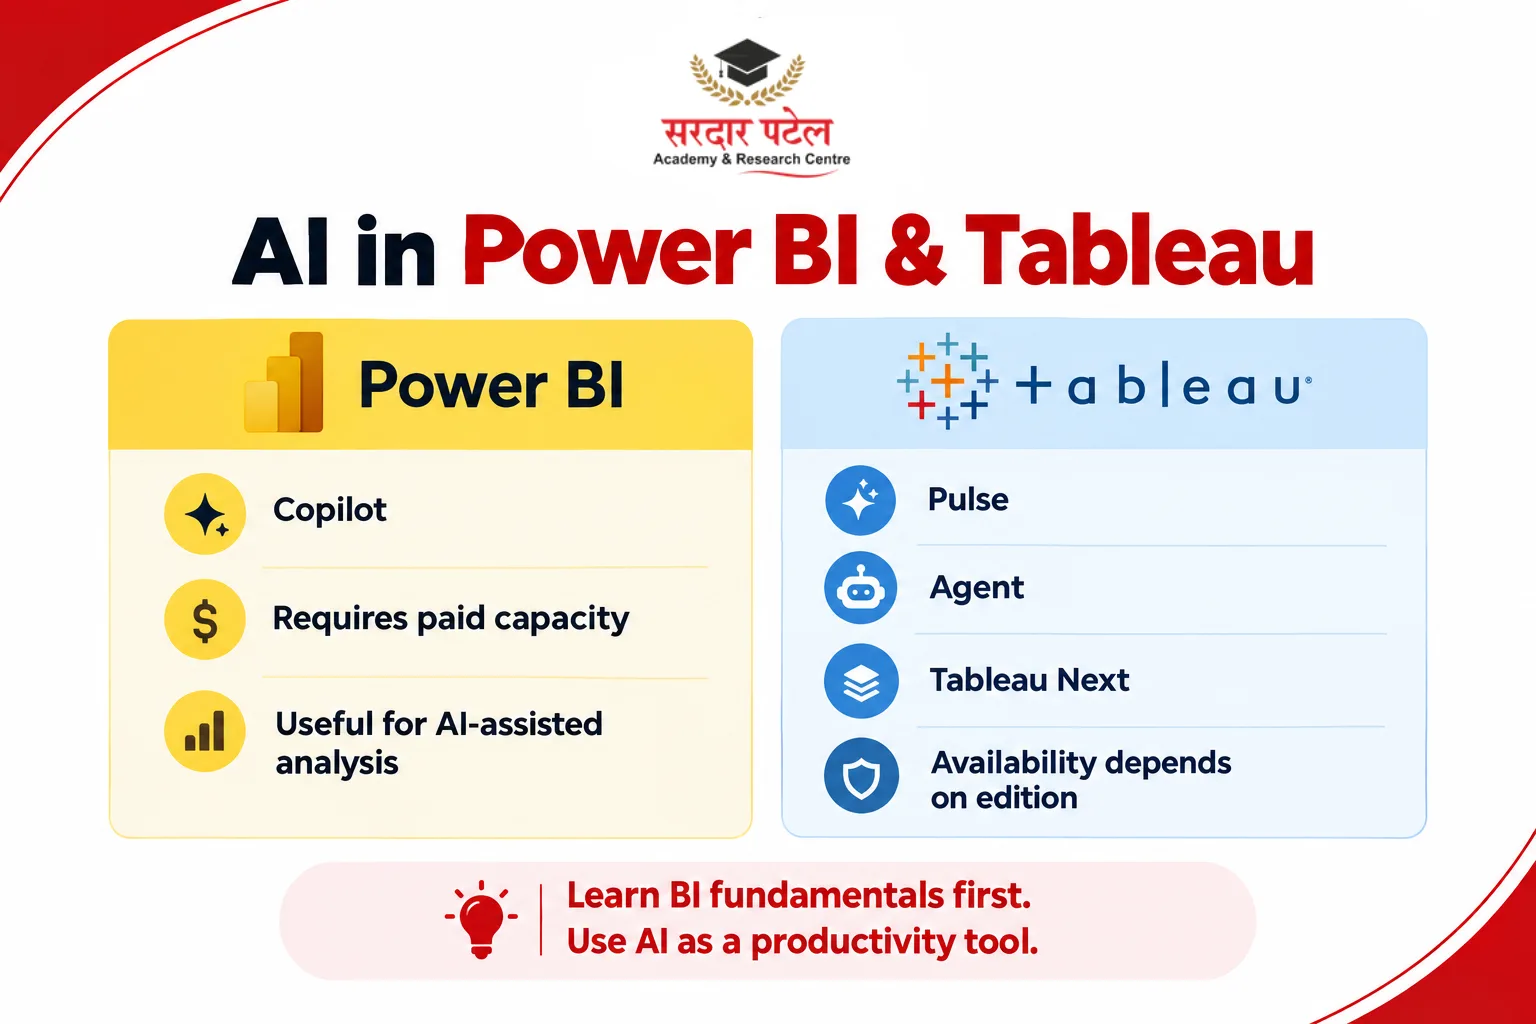
Copilot in Power BI needs the workspace to sit on paid Fabric capacity (F2 or above) or Premium capacity (P1 or above), or you can use a Fabric Copilot capacity, which is billed only for Copilot usage. A Pro or Premium Per User license alone is not enough. Third-party guides put the smallest Fabric capacity, F2, at roughly $263 a month at pay-as-you-go rates, which is around ₹25,000, so this is usually a company decision, not a learner's. See Microsoft Learn for the current rules.
On the Tableau side, AI features such as Pulse, Agent, and Tableau Next depend on your edition, and some are sold through Salesforce sales. Tableau Next is a separate Salesforce-linked product line; entry pricing is reported at around $40 per user per month, with higher tiers quoted by Salesforce. Check Tableau's pricing page for what your edition includes.
For a beginner, the takeaway is simple: the free tools do not include these assistants, so focus on fundamentals and treat AI as a later bonus. Learn to read a data model and check a total by hand before you trust any assistant's answer.
Pros and cons
Power BI
- Pros: familiar for Excel users, Power Query built-in, strong Microsoft integration, free desktop authoring tool, much lower per-user price.
- Cons: desktop app is Windows-only, DAX takes time to master, sharing usually needs a paid license, online sign-up needs a work or school email, Copilot needs paid capacity.
Tableau
- Pros: excellent visual control, smooth data exploration, desktop app on Windows and Mac, two free desktop editions, an active public gallery for inspiration.
- Cons: the seat that builds and shares dashboards costs several times more than Power BI Pro, annual contracts only, data prep sits in a separate app.
Which one fits you?
There is no universal best tool, only the best fit for your situation.
- Students and beginners: Start with Power BI if you use Windows and want a free way to practice. Choose Tableau Desktop Free Edition if you are on a Mac, or Public Edition if you want a public portfolio built on open data.
- Working professionals switching careers: Check which tool your current or target employer uses. Understanding the data analytics career scope, skills, and salaries can also help you plan your learning path.
- Business owners: If your team lives in Excel and Microsoft 365, Power BI is the easier rollout. If you already use Salesforce, Tableau may connect more naturally.
- Data-heavy or design-led analysts: Tableau's visual freedom can be worth the extra cost and effort.
A free third option: Looker Studio
If your budget is close to zero, look at Google's Looker Studio as well. It runs in the browser, so it works on Windows, Mac, and shared lab PCs without installation, and it connects easily to Google Sheets. It is lighter than Power BI or Tableau for heavy modeling, and you should check Google's current terms for connectors and paid features. For a first dashboard or a quick portfolio piece, it is a useful free way to learn the basics of charts, filters, and dashboard design, which transfer to either paid tool.
The Delhi NCR job market
Delhi NCR stretches across Delhi, Noida, Gurugram, Faridabad, and Ghaziabad. Employers here include IT services firms, e-commerce companies, logistics providers, banks, and telecom businesses, all of which produce sales, customer, and operations data. These roles also connect with the wider data analytics career opportunities available to learners with practical skills.
We are not quoting posting counts or salary premiums for each tool, because most published figures name no source or date. What we can offer is a commonly seen tendency, not measured data: reporting and MIS roles in Microsoft-heavy organizations often mention Power BI alongside Excel and SQL, while Salesforce-centric companies and consulting-style analytics teams more often list Tableau. Test that against real postings yourself.
Three illustrative profiles (composites, not case studies) show how the choice plays out locally:
- A commerce student in North Campus who shares a college PC should first check whether software can be installed. A personal Windows laptop opens the Power BI route; a Mac points to Tableau's free editions.
- An MIS executive in Noida whose team lives in Excel and Teams gets the fastest payoff from Power BI, because the data, the sharing, and the colleagues are already in Microsoft's ecosystem.
- An analyst in Gurugram at a company that runs Salesforce should look hard at Tableau, since the tools sit closer together there.
Run a 15-minute tally:
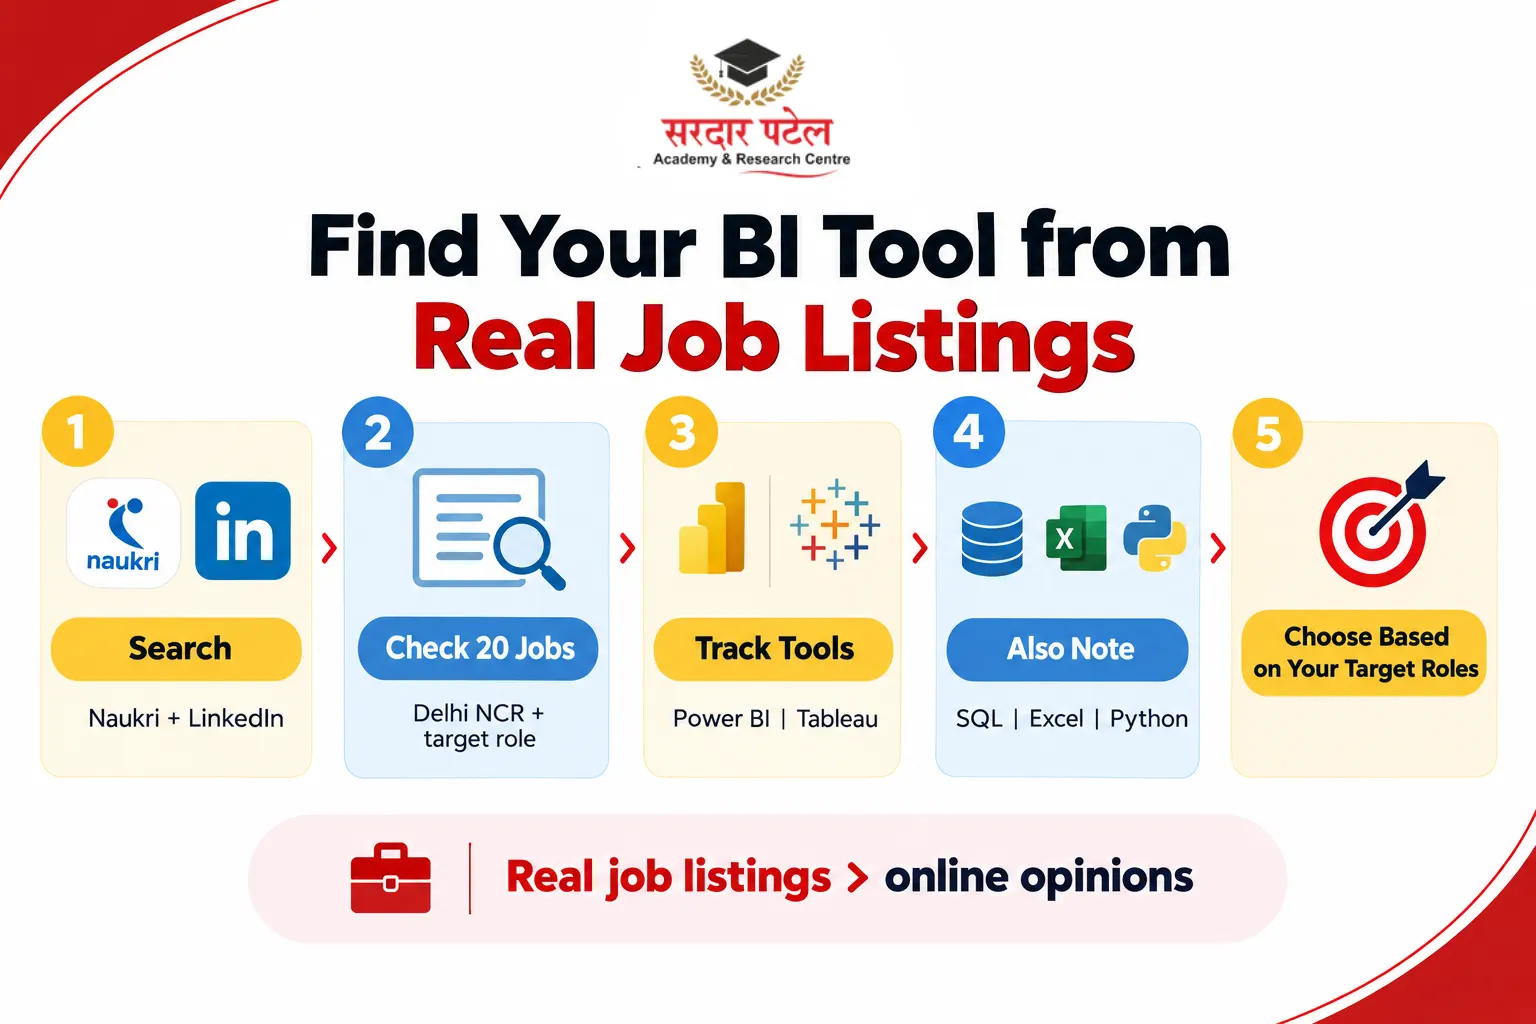
- Search "data analyst" on Naukri or LinkedIn Jobs, with location set to Delhi NCR and the experience level you would apply for.
- Open the first 20 postings and skip duplicates.
- Note which tool each posting names, and whether SQL, Excel, or Python appear too.
Copy this table into your notes:
| Tool named in the posting |
Count out of 20 |
| Power BI only |
|
| Tableau only |
|
| Both |
|
| Neither or other |
|
| SQL mentioned |
|
| Excel mentioned |
Whichever tool dominates the roles you would actually apply for is your first pick. If the count is close, decide on practical grounds: on a Windows PC with a tight budget, Power BI is cheaper to practice with; on a Mac, or if you want strong visual design skills, start with Tableau's free editions. Notice also how many postings ask for SQL and Excel: those skills show up in nearly every analyst role regardless of the BI tool. Our article Delhi Companies Hiring More Data Analysts is a useful starting list of employers to research.
Certifications
Power BI: Microsoft's Power BI Data Analyst Associate (exam PL-300) is the main credential. The exam gives you 100 minutes, and a score of 700 out of 1000 is needed to pass. The fee in India is listed at roughly ₹4,865 before tax on Microsoft's India page at the time of writing, but fees vary by country and change, so check the PL-300 page before booking. Associate certifications expire after a year but can be renewed through a free online assessment on Microsoft Learn.
Tableau: Tableau exams are run by Salesforce. The main analyst credential is the Salesforce Certified Tableau Data Analyst exam, which covers connecting to and transforming data, exploring it, building visualizations, and publishing content. Start with the Trailhead prep guide and check the current exam fee on your Trailhead Academy account, since third-party sites quote different amounts.
A certificate can support your CV, but in our view, a portfolio of real dashboards says more.
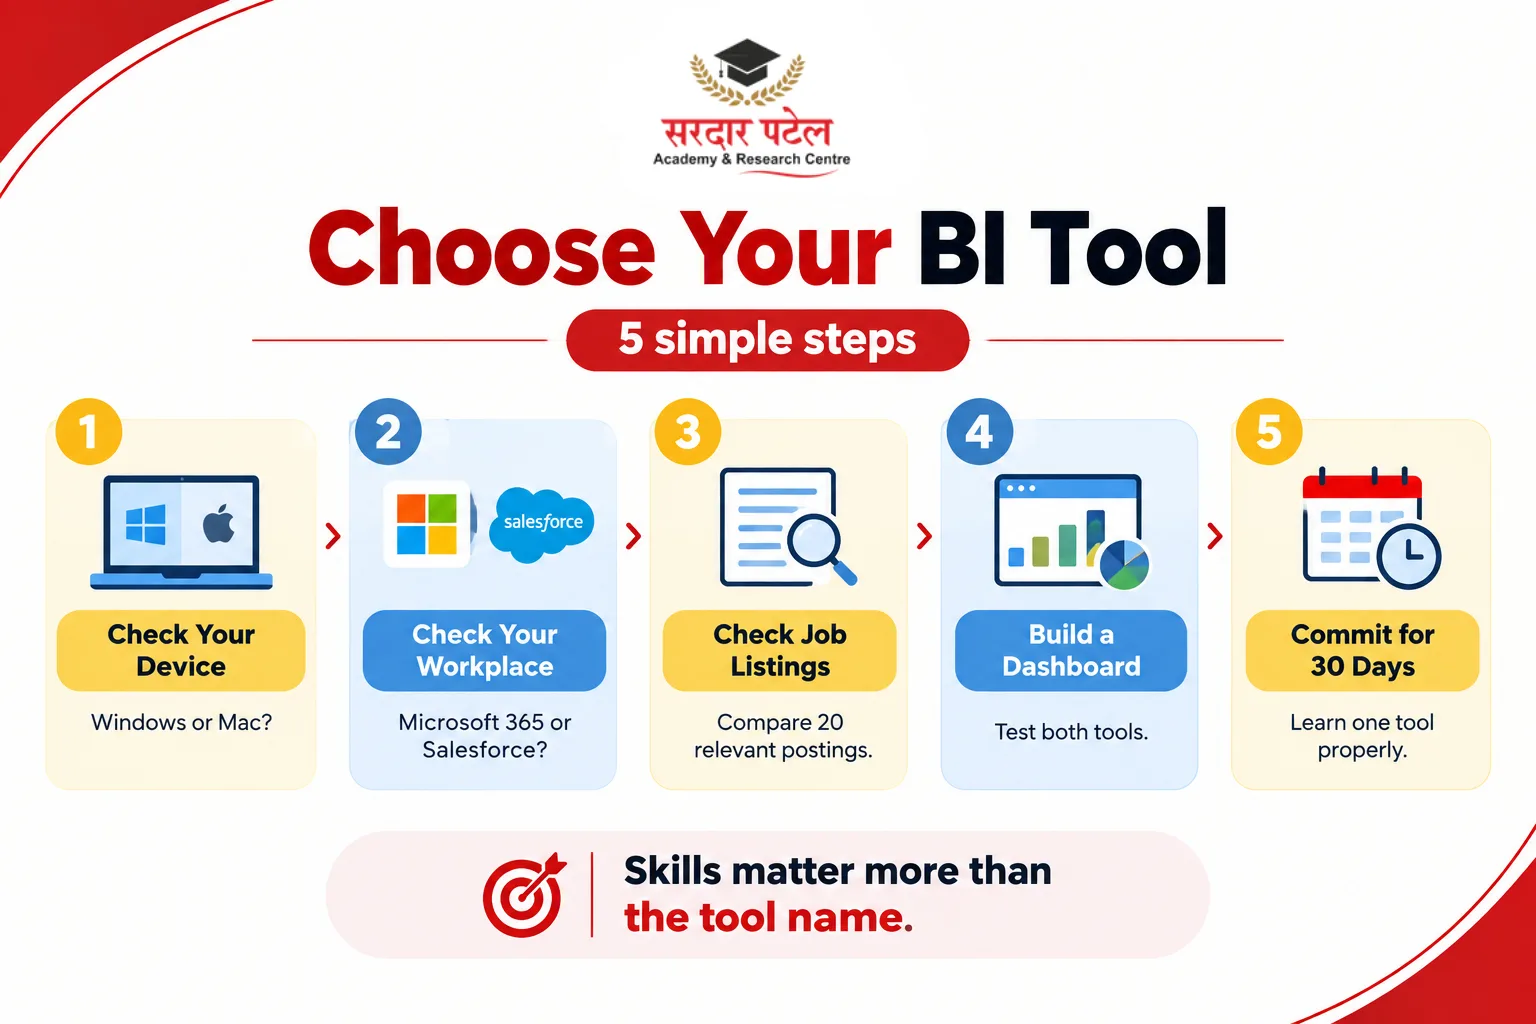
How to choose in 5 steps
- Check your device. Power BI Desktop will not install on a Mac, and a shared college or lab PC may not let you install software at all. Tableau Desktop's free editions install on both Windows and Mac. Sort this out early.
- Look at your data and workplace. Excel and Microsoft 365 point toward Power BI. Salesforce or a design-led team points toward Tableau.
- Run the 20-posting tally from the Delhi NCR section on roles you would actually apply for.
- Run a weekend test. Build the same small sales dashboard in both. Our Power BI Dashboard Tutorial and Data Analytics Project Ideas for Students give you ready-made practice tasks.
- Commit for 30 days. Finish one real project in one tool before opening the other.
Free ways to learn
- Power BI: Microsoft Learn has free learning paths, including the PL-300 study guide.
- Tableau: Tableau's free training videos and Trailhead modules, plus the Tableau Public gallery for inspiration.
- Both: YouTube walkthroughs are fine for getting started, but rebuild every dashboard yourself instead of only watching.
YouTube walkthroughs are fine for getting started, but rebuild every dashboard yourself instead of only watching. A structured data analytics learning guide can also help you move from fundamentals to practical projects.
Common mistakes and practical tips
Mistakes to avoid
- Picking a side from internet arguments. Loud opinions rarely match your situation.
- Skipping the basics. Tools matter less than understanding rows, columns, joins, and averages.
- Publishing private data to Tableau Public. Use open or sample data there, and keep private files in Free Edition.
- Ignoring the license. A brilliant dashboard nobody else can open helps no one.
- Treating the choice as permanent. Concepts like filters, measures, and dashboard design transfer easily between tools.
Practical tips
- Keep an untouched copy of your raw data before cleaning.
- Check one total by hand to confirm your dashboard is correct.
- Put a one-line takeaway under every chart. A chart without a "so what" is decoration.
Conclusion: pick a starting point, then build
There is no single winner. Power BI suits most beginners, Excel users, and small businesses. Tableau suits people who want deeper visual control and open-ended exploration.
Your next steps are simple: check your device, tally 20 job postings, build one small dashboard, and commit to a tool for 30 days. Once you have hands-on experience, the choice usually becomes much easier.
If you want help choosing the right BI tool for your goals, the team at Sardar Patel Academy & Research Centre (SPARC) in GTB Nagar, North Campus, Delhi can guide you.
Explore the courses on the SPARC website or get in touch to talk through the learning path that fits you.
FAQs
Power BI is usually easier for people who already know Excel, thanks to Power Query and familiar formulas. Tableau's drag-and-drop canvas is also beginner-friendly, but advanced calculations take practice. Both need a few weeks of regular building to feel comfortable.
Both appear in analyst listings, and the balance depends on the employer. Run the 20-posting tally for your city and target roles. If the result is close, choose based on your device and budget, as described above.
Power BI Desktop is free to download and use on Windows. Publishing to your private workspace works with a free license, but sharing reports with others generally requires a paid license (Pro is listed at $14 per user per month), unless the content sits in Premium or Fabric F64+ capacity.
Yes, in two forms. Desktop Free Edition keeps your work on your own machine. Desktop Public Edition can publish to Tableau Public, where everything is visible to everyone. Neither can publish to Tableau Cloud or Server, and Public Edition is not for commercial use. Professional use needs a paid license.
Power BI Desktop runs only on Windows. Mac users can work in the Power BI Service through a browser, which has fewer authoring features than Desktop and needs a work or school account, or run Windows through a virtual machine or cloud PC. Tableau's free desktop editions install on Mac.
Yes, and many analysts do. Learn one properly first, then pick up the second in a few weeks, because the underlying ideas overlap heavily.
Not to begin. Both tools work through menus and drag-and-drop. SQL helps a lot later, and DAX in Power BI and calculated fields in Tableau are light formula skills rather than full programming.