+91 9312966129
 sparc.enquiry01@gmail.com



How to Use ChatGPT to Analyse Excel Data Step by Step
Learn how to use ChatGPT to analyse Excel data step by step: prepare your sheet, write prompts, get formulas, build charts and verify every single result.

Every analyst has opened a workbook, scrolled through thousands of rows and wondered where to begin. The numbers are all there, but the story is hiding. That is where an AI assistant earns its place. This guide shows you how to use ChatGPT to analyse Excel data, from the first upload to the final check, with prompts you can copy and adapt.
We will keep things practical: preparing the file, asking sharper questions, generating ChatGPT formulas, building charts and, most importantly, verifying the output before it reaches a report. Students, freshers and working professionals can follow the same process.
What Does AI Excel Analysis Actually Mean?
AI Excel analysis means describing what you want from a spreadsheet in plain language and letting an AI model handle the heavy lifting. When you use ChatGPT to analyse Excel data, you upload a workbook and ask it to summarise columns, spot trends, flag outliers or draw charts. According to OpenAI's data analysis guide, it can also run Python-based calculations and statistical analysis behind the scenes for some tasks.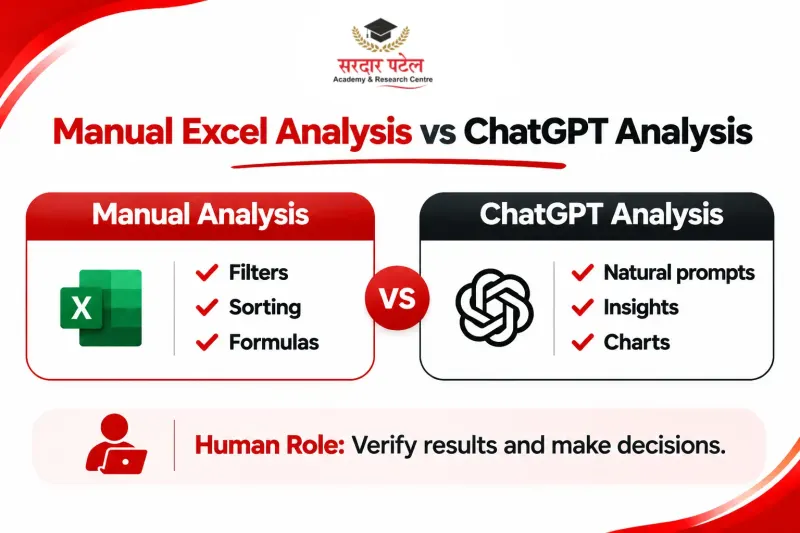
It speeds up the routine side of spreadsheet insights, while you stay responsible for the logic and the conclusions.
| Task |
Doing it manually |
With ChatGPT's help |
| Understanding a new sheet |
Scroll, filter and guess |
Ask for a column-by-column summary |
| Writing a nested formula |
Search forums, trial and error |
Describe the goal, get a draft |
| Spotting odd values |
eyeball |
Ask for outliers and duplicates |
Prepare Your Workbook Before Uploading
Messy input produces messy answers, so tidy the file before you use ChatGPT to analyse Excel data. OpenAI recommends descriptive headers in the first row, one row per record and plain-language column names. It also advises against keeping unrelated tables on one sheet or leaving empty rows and columns that split the data.
- Keep one table per sheet, starting in cell A1.
- Rename vague headers such as "Col3" to something meaningful, like "Order Date".
- Remove merged cells and blank rows.
- Save the file as .xlsx or .csv.
- Mask sensitive details, such as phone numbers and confidential prices, before uploading.
If pivots, lookups and filters still feel unfamiliar, spend an evening with an Excel tutorial for data analytics beginners first. You will judge the AI's answers far better once you know what a correct one looks like.
Practise along: download the sample workbook (stationery-sales-sample-workbook.xlsx) used in this guide. It has a Sales sheet (Date, Region, Product, Units, Revenue, Salesperson ID) and a Staff sheet, so you can run every prompt below yourself. The data is synthetic and includes a few deliberate errors for the health check in Step 2.
Step-by-Step: How to Use ChatGPT to Analyse Excel Data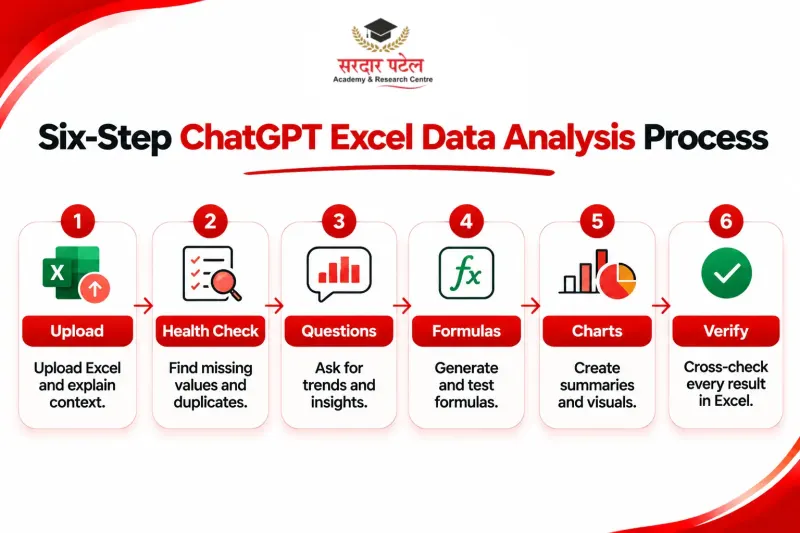
Step 1: Upload the File and Explain the Context
To use ChatGPT to analyse Excel data well, open with a short briefing. Say what the data represents, which period it covers and what decision it should support. A vague "analyse this" earns a vague reply.
Example prompt: "This workbook has monthly sales for a stationery retailer. Columns are Date, Region, Product, Units, Revenue and Salesperson ID. I want to know which regions and products drive revenue."
Step 2: Ask for a Data Health Check
Request an audit before any analysis. Ask ChatGPT to list column types, missing values, duplicate rows and inconsistent spellings, such as "Delhi" and "delhi". Data cleaning matters more than a clever prompt when you use ChatGPT to analyse Excel data, because conclusions drawn from broken data are worthless. Ask for suggested fixes rather than silent changes, so you stay in control.
Step 3: Ask Focused Questions to Generate Spreadsheet Insights
Once the file is clean, use ChatGPT to analyse Excel data by moving from general to specific. Good questions name the column, the grouping and the output:
- "Which three products bring in the most revenue, and what share of the total is that?"
- "Show monthly revenue as a line chart and point out any unusual month."
This is where AI Excel analysis pays off, turning raw rows into rankings, trends and exceptions. For some questions ChatGPT writes Python behind the scenes, so a Python pandas tutorial helps you read and question that code. If an answer feels shallow, ask "why" or request a different breakdown.
Step 4: Get ChatGPT Formulas You Can Paste Back into Excel
Often you want the logic inside your own workbook. Describe the result, mention your column letters and ask for a formula. For example: "In column G, return the salesperson's name from the Staff sheet using the ID in column F, and show 'Not found' when there is no match."
A good reply will probably use XLOOKUP, which the XLOOKUP function guide describes as a way to search a range and return the matching item. Ask the model to explain each argument, then test the formula on three rows whose answers you already know. Mention your Excel version too, because XLOOKUP is not available in Excel 2016 or 2019.
Step 5: Build Summaries and Charts
Request a summary table by region and product, then a chart that suits the message: bars for comparisons, lines for change over time. If you want the same view inside Excel, ask for the steps to build it as a PivotTable. Pivot tables and pivot charts are also covered in the Advanced Excel part of the Data Analytics Course with AI at Sardar Patel Academy & Research Centre, which is a good place to practise them.
Step 6: Verify Before You Trust
Never paste a result straight into a presentation. It is good practice to review the generated code, outputs and assumptions. Ask how a figure was calculated, then spot-check it with a quick SUM or AVERAGE. For a stronger check, rebuild the same summary yourself using Microsoft's guide to creating a PivotTable. If the two disagree, the result on your actual data wins until proven otherwise.
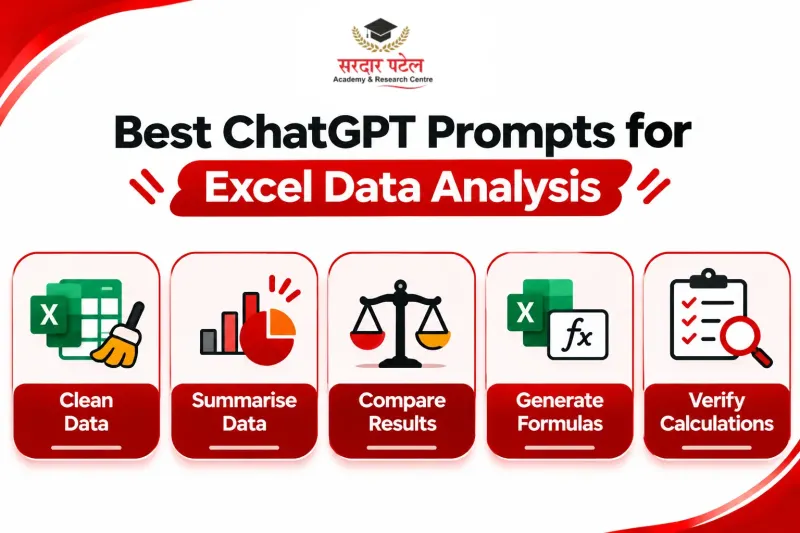
Prompt Cheat Sheet
| Goal |
Prompt starter |
| Clean |
"List columns with missing values or inconsistent spellings and suggest fixes." |
| Summarise |
"Give me a one-paragraph summary of what this dataset shows." |
| Compare |
"Compare Q1 and Q2 revenue by region and highlight the biggest change." |
| Formula |
"Write an Excel formula that does X. Explain each part." |
| Check |
"Show the steps you used so I can verify this figure." |
Formula Examples You Can Try
These examples assume columns A to F hold Date, Region, Product, Units, Revenue and Salesperson ID, with data starting in row 2. Always test a formula on a few rows you can check by hand.
| Prompt |
Formula |
What it does |
| "Total revenue for Delhi" |
=SUMIFS(E:E,B:B,"Delhi") |
Adds revenue only where Region is Delhi |
| "Flag orders under 5 units" |
=IF(D2<5,"Small order","OK") |
Labels each order by size |
| "Remove extra spaces in Region" |
=TRIM(B2) |
Cleans stray spaces before grouping |
| "Find the salesperson's name" |
=XLOOKUP(F2,Staff!A:A,Staff!B:B,"Not found") |
Looks up the name from the Staff sheet |
Data Privacy: What Not to Upload
A spreadsheet can hold more than you notice. Before you use ChatGPT to analyse Excel data, remove or mask anything you would not email to a stranger:
- Personal details such as phone numbers, addresses and ID numbers.
- Confidential prices, salaries or client names.
- Anything your organisation's policy says must stay internal.
OpenAI also says that available file types, limits and data settings can vary by plan and workspace, so check your own account's data controls before uploading anything sensitive.
An Illustrative Example
Picture the stationery sheet from Step 1. You ask for revenue by region, and ChatGPT reports that one region trails the rest. You follow up: "Is that because of fewer orders or lower prices?" It splits revenue into units and average price, and the pattern points to order volume. You then ask for a formula that flags small orders, paste it into a helper column and filter.
In minutes you have gone from a raw sheet to a specific question for the sales team. This scenario is invented for teaching, so your own data will differ. ChatGPT is also only one option, so see our overview of the best AI tools for data analysis before you settle on a toolkit.
ChatGPT vs Copilot in Excel
ChatGPT works on files you upload to a chat, while Copilot in Excel sits inside the workbook and needs a Microsoft 365 plan that includes it. Neither replaces your judgement. For a full side-by-side, read our ChatGPT vs Copilot for Data Analysis guide.
If your team lives in Google's ecosystem, our notes on Google Sheets for data analysis show which of these habits carry over.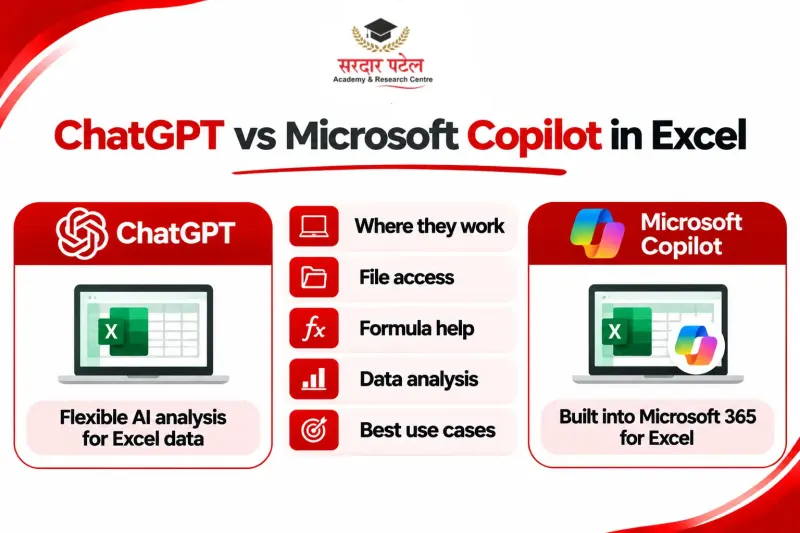
When Excel and ChatGPT Are Not Enough
Very large datasets, repeatable dashboards and multiple data sources need heavier tools. Our comparison of Power BI vs Excel for data analysis helps you decide when to switch. For very large or recurring work, a dashboard tool or Python is usually the better route.
Common Mistakes to Avoid
Most problems come from a few avoidable habits:
- Uploading sensitive files unmasked. See the privacy section above.
- Asking vague questions. Name the metric, the grouping and the goal.
- Skipping the spot check. Microsoft's Copilot in Excel FAQ says it is critical to review, edit and verify what Copilot creates, and the same caution applies here.
- Uploading pictures of tables. OpenAI advises against keeping critical information inside images, so upload a spreadsheet instead.
- Assuming the whole file was read. If a result looks incomplete, ask ChatGPT to inspect specific sheets, rows or columns.
Why This Skill Matters for Your Career
Employers in analytics, MIS reporting and business intelligence still expect solid Excel skills, and knowing how to use ChatGPT to analyse Excel data makes you faster, not redundant. If you are wondering where AI leaves the profession, read Can AI replace data analysts? for a balanced view.
Conclusion
Learning to use ChatGPT to analyse Excel data is less about clever prompts and more about good habits: clean input, specific questions, tested formulas and a final check against your own numbers. Do those consistently and AI becomes a real time-saver rather than a source of confident mistakes.
The quickest way to build that habit is to practise Excel and AI side by side on realistic datasets. At Sardar Patel Academy & Research Centre in Delhi, you can learn data analysis in a classroom with guided projects.
The Data Analytics Course with AI covers Advanced Excel, SQL, Python, Power BI and Tableau with AI tools. Open a sample workbook today, try the prompts above and see how far one hour of practice takes you.
FAQs
Yes. OpenAI lists .xls, .xlsx and .csv among supported spreadsheet types, though upload limits vary by plan and account.
That depends on your organisation's rules and your data settings. Remove personal and confidential fields where possible, and review your account's data controls first.
Basic skills help a lot. You do not need to memorise formulas, but you must recognise a wrong answer, which is why tables, filters and pivots matter.
Available features and file limits can vary by plan, model and workspace settings, so check what your own account offers before planning a workflow around it.
Not really. It can summarise quickly and explain how to build a PivotTable, but a PivotTable in your workbook updates with your data and is easier to audit.
Usually the prompt lacked detail, such as column letters, sheet names or your Excel version. Share those, paste the error message and ask for a fix.
Ask for one sheet or a set of columns at a time, or split the workbook into smaller files. As a guide, OpenAI's help page currently puts CSV files and spreadsheets at roughly 50 MB (depending on row size), with up to 512 MB per file and 10 files per conversation. These limits change, so check OpenAI's page for the latest figures.