+91 9312966129
 sparc.enquiry01@gmail.com



Data Analytics Course for Housewives & Freshers
Explore a beginner-friendly Data Analytics Course for Housewives & Freshers. Learn Excel, SQL, Power BI & Python with practical training at SPARC.
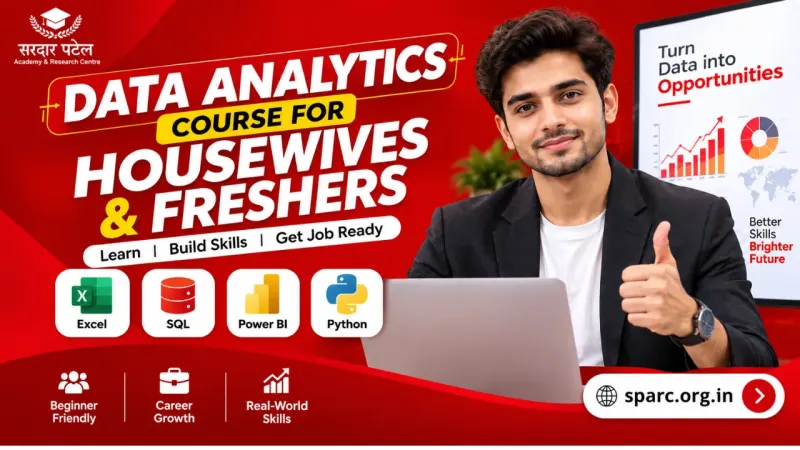
Table of Contents
- Why Consider Data Analytics as a Career Path?
- Is Data Analytics Realistic for Complete Beginners?
- What Skills Does a Good Data Analytics Course Actually Teach?
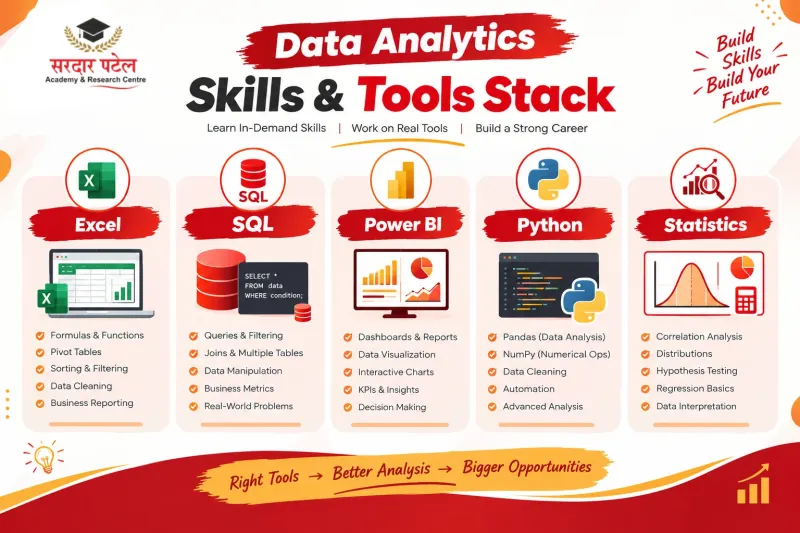
- Microsoft Excel
- SQL
- Power BI
- Python (Pandas, NumPy)
- Statistics Fundamentals
- Can You Learn Data Analytics After a Career Break?
- Do Freshers Need a Technical Degree to Start?
- What Career Paths Open Up After a Data Analytics Course?
- What Should You Actually Check Before Choosing a Course?
- About Sardar Patel Academy & Research Centre (SPARC)
- A Simple 8-Step Roadmap to Get Started
- Conclusion
- Ready to Start?
Starting a new career can feel daunting — whether you're a homemaker returning to work after a career break, a fresher with no professional experience, or anyone stepping back into the workforce after time away. The good news: you don't need a technical degree or years of prior experience to start learning a genuinely in-demand skill.
Data analytics is one such field. If you're completely new to the field, start with our what is Data Analytics beginner guide to understand the fundamentals before choosing a learning path. With structured learning, consistent practice, and real-world projects, beginners can build job-ready skills in a matter of months, not years. Many businesses across Delhi NCR, Bengaluru, and Pune now hire for entry-level analyst, reporting, and MIS roles, making this a practical skill to build regardless of your starting point.
A well-designed data analytics course for beginners — whether you're a homemaker, someone returning after a break, or a fresh graduate — helps learners understand how businesses use data to make decisions, spot trends, prepare reports, and measure performance — skills that translate directly into employability.
Why Consider Data Analytics as a Career Path?
Data now drives decisions across retail, banking, healthcare, education, e-commerce, marketing, finance, and operations. Companies need people who can organise information, spot useful patterns, build reports, and communicate insights clearly to non-technical stakeholders. Understanding the importance of data analytics in business can also help beginners see how these skills contribute to real-world decision-making.
The World Economic Forum also identifies AI and big data among the skills expected to see increasing use by 2030, while data analysts and scientists are among the roles highlighted in its jobs outlook.
This doesn't mean every learner needs to become a programmer.
A beginner can start with spreadsheet skills, move to SQL and visualisation tools, and later explore Python — building complexity gradually rather than all at once. The typical learning arc looks like: collect → clean → analyse → visualise → communicate.
For freshers: this path turns theoretical education (engineering, commerce, arts — any background) into practical, demonstrable skills.
For those returning to work after time away — including housewives stepping back into a professional role: it offers a structured way to re-enter the workforce without assuming prior analytics experience, and without needing to "catch up" on years of missed technical education.
Is Data Analytics Realistic for Complete Beginners?
Yes — provided you're willing to practice consistently. Analytics is less about innate technical talent and more about repetition: the same way spreadsheet fluency builds with use, SQL and dashboarding skills build with hands-on practice.
You don't need to walk in already knowing Excel, SQL, Python, or Power BI. A good beginner program introduces concepts progressively:
- Understanding rows, columns, and datasets
- Excel formulas and functions
- Cleaning and organising data
- Basic statistics
- SQL queries
- Power BI dashboards
- Python for data analysis
- Practical, portfolio-ready projects
- Resume and portfolio building
- Interview preparation
This step-by-step structure is what makes a course approachable for someone who has never worked with data professionally.
What Skills Does a Good Data Analytics Course Actually Teach?
A useful course focuses on tools that solve real business problems — not just theoretical definitions. To understand the key technologies used in analytics, explore our guide to data analytics tools you must know.
Microsoft Excel
Often the most comfortable starting point, since the interface is familiar. Learners build skills in:
- Formulas and functions
- Sorting, filtering, and data cleaning
- Pivot tables and charts
- Conditional formatting
- Basic business reporting
SQL
SQL is how analysts interact with data stored in databases. Beginners learn to:
- Retrieve and filter records
- Sort and group data
- Combine (join) multiple tables
- Calculate business metrics
- Answer real business questions using structured data
This is often the single most useful skill for freshers, since almost every analytics role touches a database at some point.
Power BI
Power BI converts raw spreadsheets into interactive dashboards and KPI reports — turning hundreds of rows into visuals that decision-makers can actually act on quickly.
Python (Pandas, NumPy)
Introduced once analytics fundamentals are solid. Python becomes valuable for larger datasets, automation, and more advanced statistical analysis — skills that differentiate a candidate for slightly more senior entry-level roles.
Statistics Fundamentals
Descriptive statistics, distributions, correlation, and basic hypothesis testing — enough to interpret data correctly, not misread it.
Can You Learn Data Analytics After a Career Break?
Yes — a break in your career timeline doesn't reset your ability to learn. What matters more is choosing a learning format that fits your actual routine, not an idealised one.
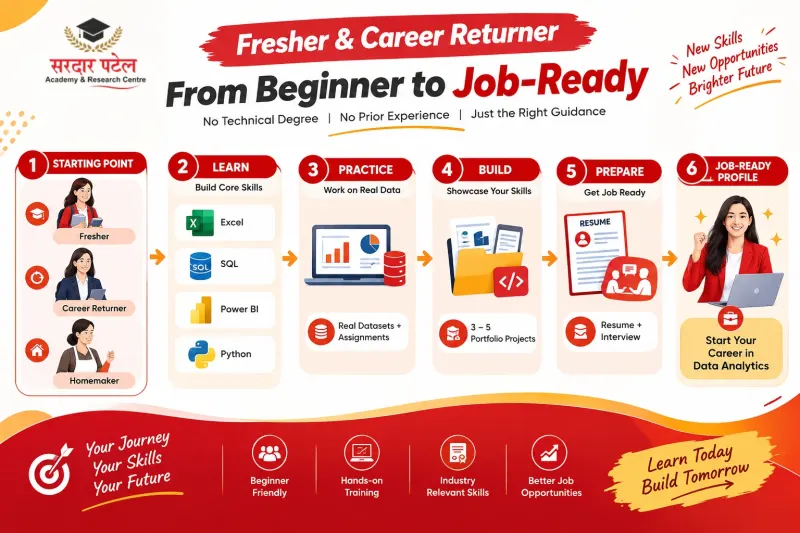
Since career returners — including many homemakers balancing household responsibilities — are often managing multiple responsibilities throughout the day, it helps to break learning into smaller, repeatable cycles rather than attempting to learn everything in one sitting:
Learn → Practice → Build a mini-project → Review → Repeat
Even 3–4 focused sessions a week, done consistently over a few months, build more retention than long irregular study blocks. The goal isn't memorising every Excel formula or SQL command — it's developing the instinct to approach a business problem through data.
Do Freshers Need a Technical Degree to Start?
No. A technical degree can help for certain specialised roles, but it isn't a prerequisite for entry-level analytics work. If you're a fresher, you can also explore data analytics course eligibility and career opportunities to understand the educational background and career options available in this field.
What actually matters to hiring managers:
- Your ability to learn and apply tools independently
- How you approach and solve a data problem
- What you can show — not just what you claim to have studied
Build your profile with projects such as:
- Sales performance dashboard
- Customer segmentation/analysis report
- E-commerce order analysis
- Marketing campaign performance analysis
- Employee attendance dashboard
- Monthly business performance report
Building practical projects is also emphasised by established data-analytics certificate programs, where learners use hands-on activities and projects to develop job-ready skills.
A finished project gives you something concrete to walk an interviewer through — far more persuasive than simply saying "I completed a course."
What Career Paths Open Up After a Data Analytics Course?
Outcomes depend on your skills, prior education, project quality, and the employer's specific requirements. Entry-level roles commonly explored include:
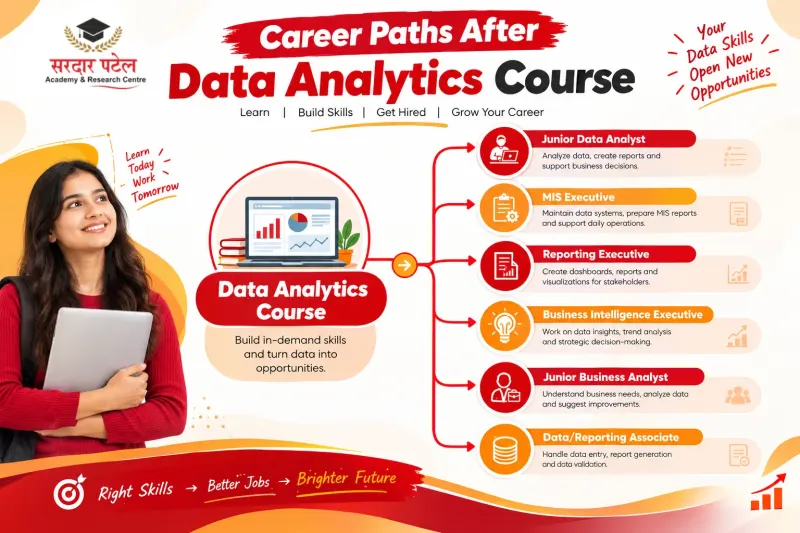
| Role |
Typical Focus |
| Junior Data Analyst |
Reporting, dashboards, basic SQL |
| MIS Executive |
Recurring reports, Excel-heavy operations |
| Reporting Executive |
Automated/scheduled business reports |
| Business Intelligence Executive |
Power BI/Tableau dashboards |
| Junior Business Analyst |
Requirements + data-driven recommendations |
| Data/Reporting Associate |
Cross-functional data support |
Salary can vary significantly by experience, location, company, and role. For a current benchmark, readers can also explore Data Analyst salaries in India on Glassdoor.
Not everyone lands a "Data Analyst" title immediately — many start in reporting, MIS, or operations roles and grow into analytics-focused positions. To explore career growth, required skills, and salary expectations in greater detail, check our guide to data analytics career scope, skills & salaries.
You can also explore current Data Analyst job openings in India on job portals such as Naukri or LinkedIn to understand the types of roles, locations, and skills employers are currently hiring for.
Before choosing a course, it's also important to understand [Which Data Analytics Certification is Provided?] and how the certification fits into your overall career profile. That's why the smarter goal is building employable skills, not chasing a specific job title on day one.
What Should You Actually Check Before Choosing a Course?
A course having "Data Analytics" in its name tells you almost nothing. Before enrolling, verify:
| What to Check |
Why It Matters |
| Practical training |
Will you work with real datasets and assignments, or just watch theory? |
| Tool coverage |
Does it cover Excel, SQL, Power BI, Python, and statistics — not just one or two? |
| Trainer support |
Can you get doubts resolved live, not just through recorded videos? |
| Project work |
Will you finish with 3–5 portfolio-ready projects? |
| Career support |
Resume help, mock interviews, internship or placement assistance? |
| Course duration & fees |
8 months, with 2-hour classes on alternate days — includes a 1-month live internship. Scholarships of up to 65% are available for eligible learners; exact fees are shared during counselling. |
| Mode of learning |
Classroom training at the GTB Nagar (Delhi) campus, with flexible batch timings designed for working professionals and career returners. |
| Certification |
A Data Analytics with AI course-completion certificate from the institute. |
If you're looking for [Affordable Data Analytics Training for Beginners], compare the course fees, practical training, project work, and career support before enrolling.
About Sardar Patel Academy & Research Centre (SPARC)
Sardar Patel Academy & Research Centre (SPARC) has operated as a self-financed, not-for-profit NGO in Delhi since 2003, offering career-oriented technical training. Its Data Analytics Course with AI covers Advanced Excel, SQL, Python, Power BI, and Tableau, structured around 40+ hands-on projects and a 1-month live internship component.
For a fresher, the 8-month structured format offers a defined sequence to follow, rather than having to guess what to learn next. For someone returning to professional life after a break — including homemakers re-entering the workforce — flexible batch timing and a no-coding-background starting point make it easier to ease back into structured learning.
The institute provides placement support across Delhi-NCR, including resume building, mock interviews, and connections with hiring partners. Among its reported outcomes, some graduates have gone on to secure entry-level MNC roles shortly after finishing the course — for specific, current placement figures and verified success stories, it's worth asking SPARC's counselling team directly during enquiry.
If you're comparing options, explore our [Best Data Analytics Course in Delhi with Placement] guide to understand what to look for in a placement-focused program.
👉 Explore the SPARC Data Analytics Course with AI
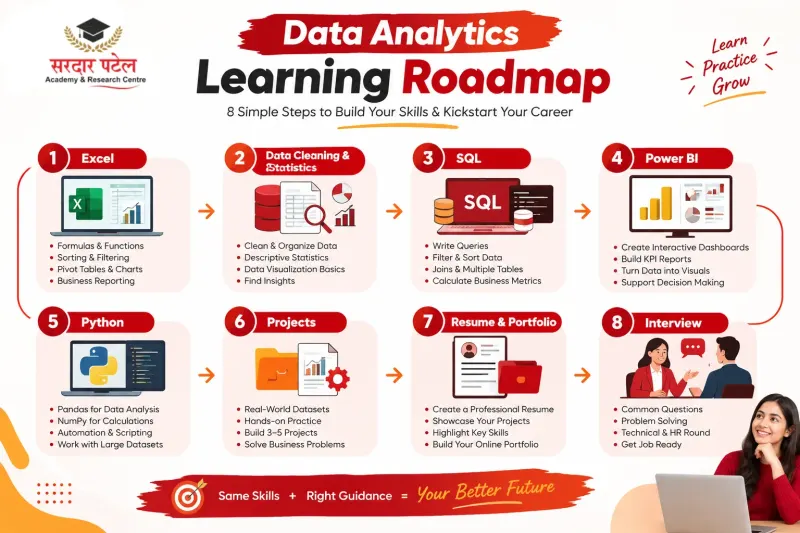
A Simple 8-Step Roadmap to Get Started
- Learn Excel fundamentals — formulas, pivot tables, cleaning data
- Understand data cleaning and basic statistics — the foundation everything else builds on
- Learn SQL — querying, filtering, joining, grouping
- Build Power BI dashboards — turn raw data into visual reports
- Learn Python for data analysis — Pandas, NumPy, basic automation
- Complete practical projects — 3–5 portfolio pieces minimum
- Build your resume and portfolio — lead with projects, not just certificates
- Prepare for interviews — practice explaining your projects, not just your course completion
Conclusion
Restarting or starting a career doesn't require a complicated technical degree. Whether you're a fresher, a career returner, or a housewife ready to step back into professional life, data analytics offers a practical, step-by-step way to build modern, transferable workplace skills.
What actually makes your learning valuable isn't the certificate — it's your ability to work with real data, solve practical problems, build clear reports, and explain your findings to someone who wasn't in the room when you did the analysis.
If you're comparing courses, evaluate them on curriculum depth, practical training, project work, trainer support, and career assistance — not just the presence of popular tool names in the syllabus.
Ready to Start?
Whether you're a fresher, someone returning to work, or a homemaker looking to build a professional skill set — if you're ready to build practical analytics skills, explore the Data Analytics program at Sardar Patel Academy & Research Centre (SPARC) and review the curriculum, training format, and career support in detail before enrolling.
👉 Enquire with SPARC today — or call +91 93129 66129 to book a free demo session or check scholarship eligibility.
FAQs
It can be, if you're looking for a modern, transferable skill and are willing to commit to regular practice. The real value comes from finishing with a portfolio of projects you can discuss confidently — not the certificate alone. It suits people who want structured re-entry into work rather than jumping straight into a full-time role.
Yes. A structured beginner program introduces Excel first (the lowest barrier to entry), then layers in SQL, Power BI, and Python progressively. With regular, consistent practice, freshers with no prior data background typically start feeling comfortable with core Excel and SQL tasks well before the course is finished.
No prior programming knowledge is required to begin. Excel and SQL don't require "coding" in the traditional sense, and Python is introduced only after the fundamentals are solid — by which point most learners find the transition manageable.
Basic comfort with numbers and logical thinking is enough to start. Statistics is taught progressively with practical examples rather than as standalone theory — you build statistical intuition through use, not memorization.
No course can honestly guarantee employment — and be cautious of any that claims it can. What a good course can do is meaningfully improve your readiness: relevant skills, a working portfolio, a stronger resume, and interview practice. The outcome still depends on your effort, the job market, and how well you present your project work.