+91 9312966129
 sparc.enquiry01@gmail.com


Python Pandas Tutorial
A hands-on Python pandas tutorial for beginners. Learn how to work with DataFrames, clean datasets, filter information, and group data using easy examples and real Python code.

Table of Contents
- What Is Pandas and Why Is It Important for Data Analysis?
- Why Pandas Is a Must-Know Tool in Any Python Pandas Tutorial
- Installing Pandas on Your System
- Understanding Pandas Data Structures
- Reading Data Into Pandas
- Exploring Your Data: The First Things to Check
- Selecting and Filtering Data
- Cleaning Messy Data
- Handling Missing Values
- Grouping and Summarising Data
- Sorting and Ranking Values
- Merging and Combining DataFrames
- A Quick, Practical Example
- Common Mistakes Beginners Make
- Forgetting inplace=
- Ignoring data types —
- Not checking for missing values early —
- Overusing loops —
- Skipping .head() and .describe() —
- Learn Pandas Practically, Not Just Theoretically
- Conclusion
What Is Pandas and Why Is It Important for Data Analysis?
If you've ever opened a messy spreadsheet and thought, "there has to be a faster way to sort through this" — there is. It's called Pandas.
This Python pandas tutorial is built for people who have never touched the library before. No jargon. No assumptions. Just clear steps you can follow along with, even if you've only written a few lines of Python in your life.
Pandas is an open-source Python library used to clean, organise, and analyse data. For a complete overview of its features, visit the official Pandas documentation. It was first built in 2008 at a hedge fund called AQR, where analysts needed a faster way to work with financial data than spreadsheets allowed. Today, it's one of the most widely used tools in data analytics, alongside Excel, SQL, and Power BI.
If you're completely new to programming, it also helps to be comfortable with Python Basics for Data Analytics before diving into Pandas — things like variables, lists, and loops make everything in this guide click faster.
Python itself now holds the #1 spot among programming languages, according to the PYPL Popularity Index, and Pandas is a big reason why so many analysts choose it. By the end of this guide, you'll know exactly how to load, clean, filter, and summarise data using Pandas — the practical skills every beginner needs.
Why Pandas Is a Must-Know Tool in Any Python Pandas Tutorial
Here's the truth: you could technically analyse data in Excel forever. However, as your dataset grows to thousands of rows, Excel often becomes slower and less efficient to work with.
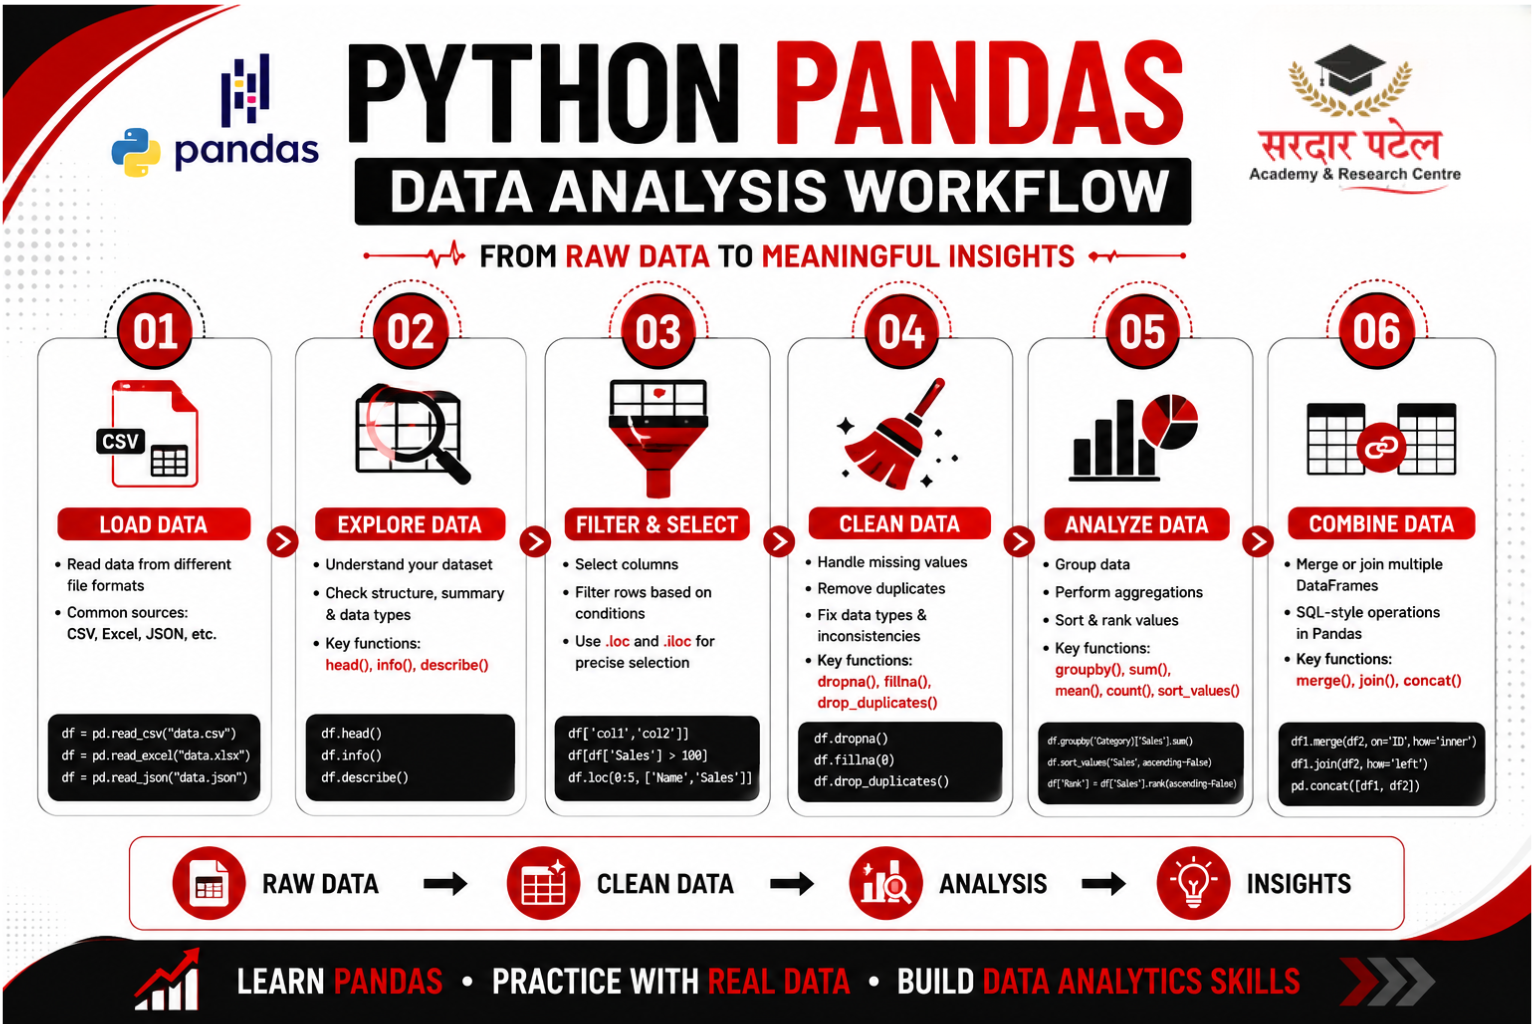
Pandas solves that problem. It lets you:
- Load huge datasets in seconds
- Clean messy, inconsistent data quickly
- Filter and sort information with a single line of code
- Group and summarise numbers the way a pivot table would
- Automate tasks you'd normally repeat by hand
This is exactly why Pandas is the backbone of most guides covering Pandas for data analytics beginners. It's not just for programmers — marketers, finance teams, and business analysts use it every day to save hours of manual work. In fact, cleaning and processing data with tools like Pandas is one of the key steps in the data science process, long before any dashboard or model gets built.
Installing Pandas on Your System
Before writing any code, you need Python installed on your computer. Once that's done, installing Pandas takes one line in your terminal or command prompt:
pip install pandas
If you're using Anaconda, you can install it with:
conda install pandas
To confirm it worked, open a Python file or notebook and run:
import pandas as pd
print(pd.__version__)
If a version number shows up, you're ready to go. Most tutorials, including this one, import Pandas using the shortcut pd — it's a convention almost every Python developer follows.
Understanding Pandas Data Structures
Pandas revolves around two core structures. Once you have a solid grasp of these basics, the remaining concepts become easier to understand.
Series: A Single Column of Data
A Series is a one-dimensional array with labels, kind of like a single column in a spreadsheet.
import pandas as pd
sales = pd.Series([250, 430, 170, 300])
print(sales)
DataFrame: A Full Table of Data
A DataFrame is a two-dimensional table made up of rows and columns — this is what you'll use most of the time.
data = {
"Product": ["Laptop", "Mobile", "Tablet"],
"Sales": [250, 430, 170]
}
df = pd.DataFrame(data)
print(df)
Think of a DataFrame as an Excel sheet living inside your Python code, except it can handle millions of rows without breaking a sweat.
Reading Data Into Pandas
Most of the time, you won't type data by hand. You'll load it from a file. Pandas makes this simple.
Reading a CSV file:
df = pd.read_csv("sales_data.csv")
Reading an Excel file:
df = pd.read_excel("sales_data.xlsx")
Reading a JSON file:
df = pd.read_json("sales_data.json")
That's it. One line, and your entire dataset is loaded into a DataFrame, ready for analysis.
Exploring Your Data: The First Things to Check
Before you clean or analyse anything, get a feel for your dataset. These commands should be the first thing you run every single time.

print(df.head())
print(df.info())
print(df.describe())
Running these three lines alone will tell you 80% of what you need to know about a new dataset.
Selecting and Filtering Data
Once you know what's in your dataset, you'll want to pull out specific rows or columns.
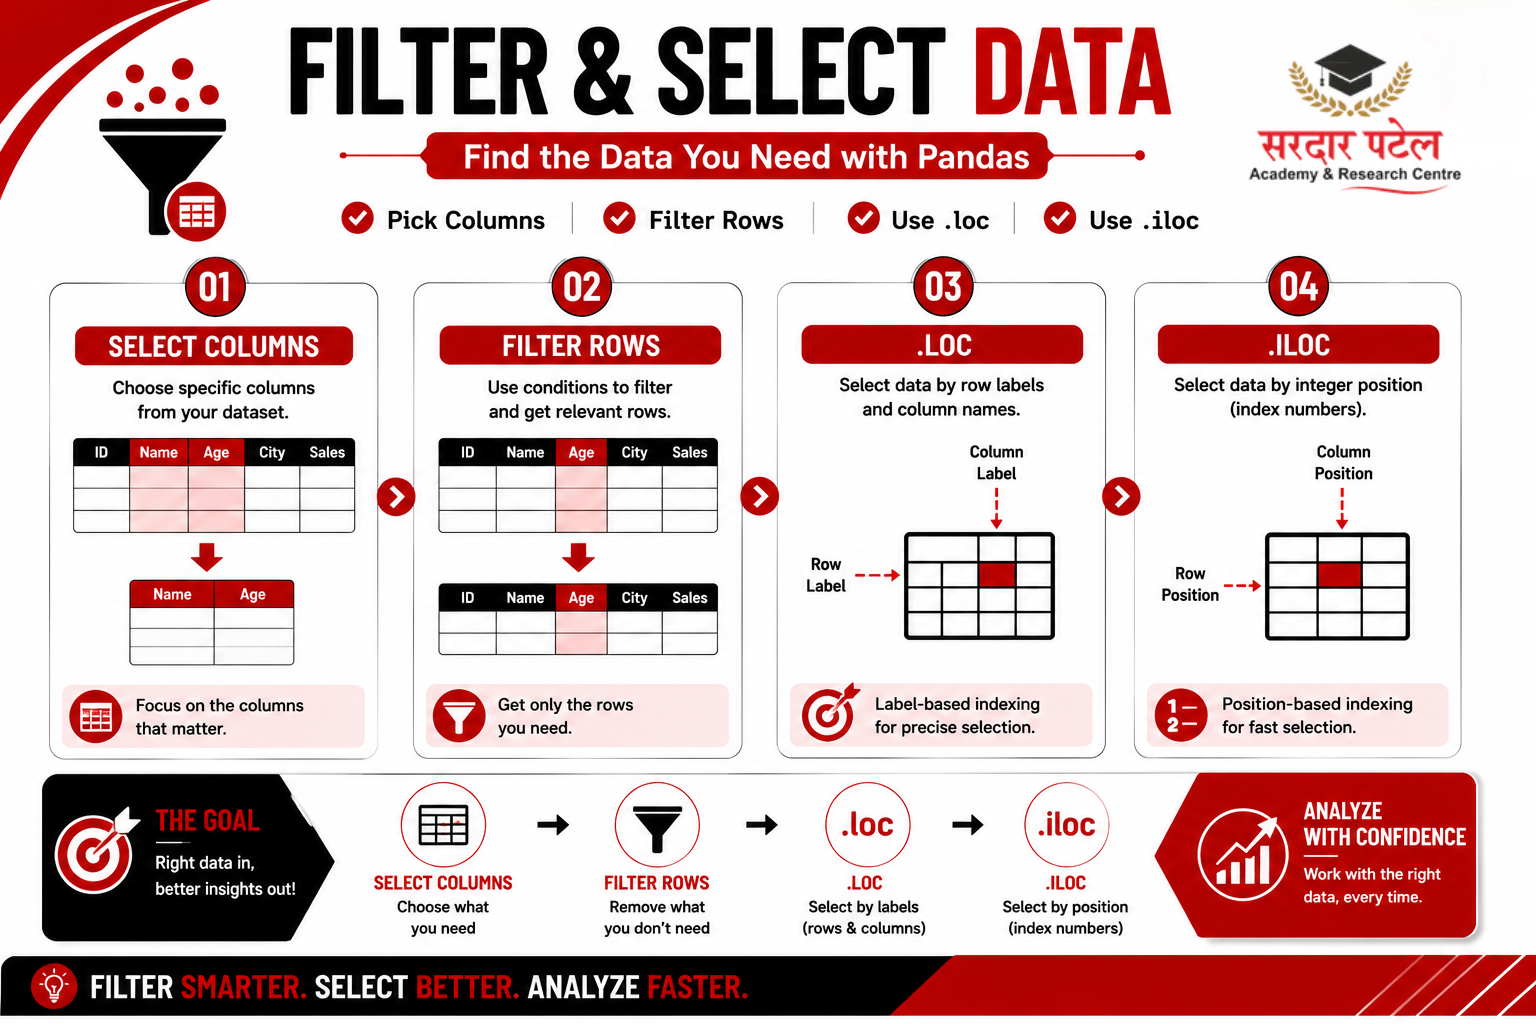
Selecting a single column:
df["Sales"]
Selecting multiple columns:
df[["Product", "Sales"]]
Filtering rows based on a condition:
high_sales = df[df["Sales"] > 200]
Filtering with multiple conditions:
result = df[(df["Sales"] > 200) & (df["Product"] == "Mobile")]
Using .loc and .iloc:
df.loc[0] # Row by label
df.iloc[0] # Row by position
df.loc[0, "Sales"] # Specific cell by label
These filtering techniques are the foundation of almost every real-world analysis you'll ever do in Pandas.
Cleaning Messy Data
Real data is rarely clean. Column names might be inconsistent, values might repeat, or data types might be wrong. Here's how to fix the most common issues. For a deeper, step-by-step walkthrough of this exact process, check out our dedicated Data Cleaning Tutorial for Beginners.
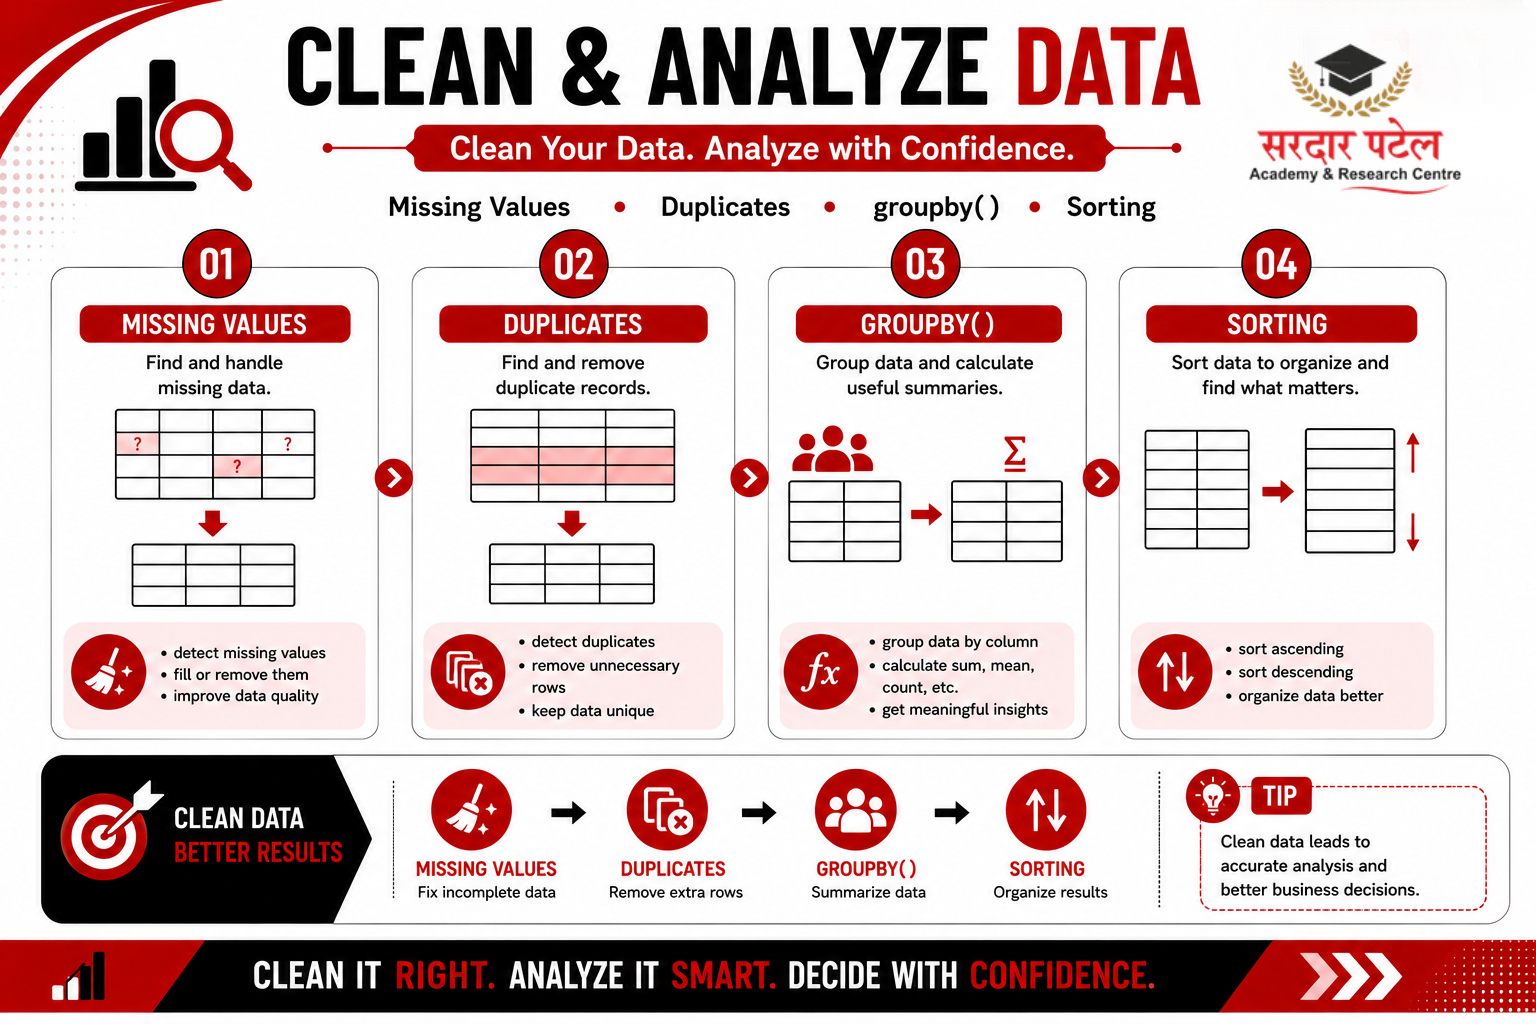
Renaming columns:
df.rename(columns={"Sales": "Total_Sales"}, inplace=True)
Removing duplicate rows:
df.drop_duplicates(inplace=True)
Changing a column's data type:
df["Total_Sales"] = df["Total_Sales"].astype(float)
Dropping unnecessary columns:
df.drop(columns=["Unnamed: 0"], inplace=True)
A few minutes spent cleaning data upfront saves hours of confusion later, especially when you're building reports or dashboards from it.
Handling Missing Values
Missing data is one of the most common headaches in any dataset. Pandas gives you a few simple ways to deal with it.
Check for missing values:
df.isnull().sum()
Remove rows with missing values:
df.dropna(inplace=True)
Fill missing values with a default:
df["Sales"] = df["Sales"].fillna(0)
Fill missing values with the column average:
df["Sales"] = df["Sales"].fillna(df["Sales"].mean())
Note: as of recent Pandas versions, calling .fillna(..., inplace=True) directly on a selected column (df["Sales"].fillna(...)) is being phased out, since that selection behaves as a copy and the change won't reliably apply back to the original DataFrame. The safer pattern is to reassign the column as shown above, or apply inplace=True on the whole DataFrame with a column mapping: df.fillna({"Sales": 0}, inplace=True).
Choosing between dropping and filling depends on your dataset. If only a few rows are missing values, dropping them is usually fine. If a large chunk of your data is missing, filling in reasonable estimates keeps your analysis intact.
Grouping and Summarising Data
This is where Pandas starts to feel like magic. The groupby() function lets you summarise data the same way a pivot table would in Excel.
df.groupby("Product")["Sales"].sum()
This groups all rows by product name and adds up the total sales for each one.
You can also apply multiple calculations at once:
df.groupby("Product")["Sales"].agg(["sum", "mean", "count"])
Common use cases for groupby:
- Total revenue by region
- Average order value by customer segment
- Number of complaints by department
- Monthly sales totals by product category
Once you're comfortable with groupby(), you can summarise almost any dataset in a few lines instead of building complex formulas.
Sorting and Ranking Values
Sorting helps you quickly spot top performers or biggest problem areas.
df.sort_values("Sales", ascending=False)
To sort by multiple columns:
df.sort_values(["Region", "Sales"], ascending=[True, False])
Merging and Combining DataFrames
In real projects, your data rarely lives in a single file. You might have one file with customer details and another with order history. Pandas lets you combine them.
merged_df = pd.merge(customers_df, orders_df, on="customer_id", how="left")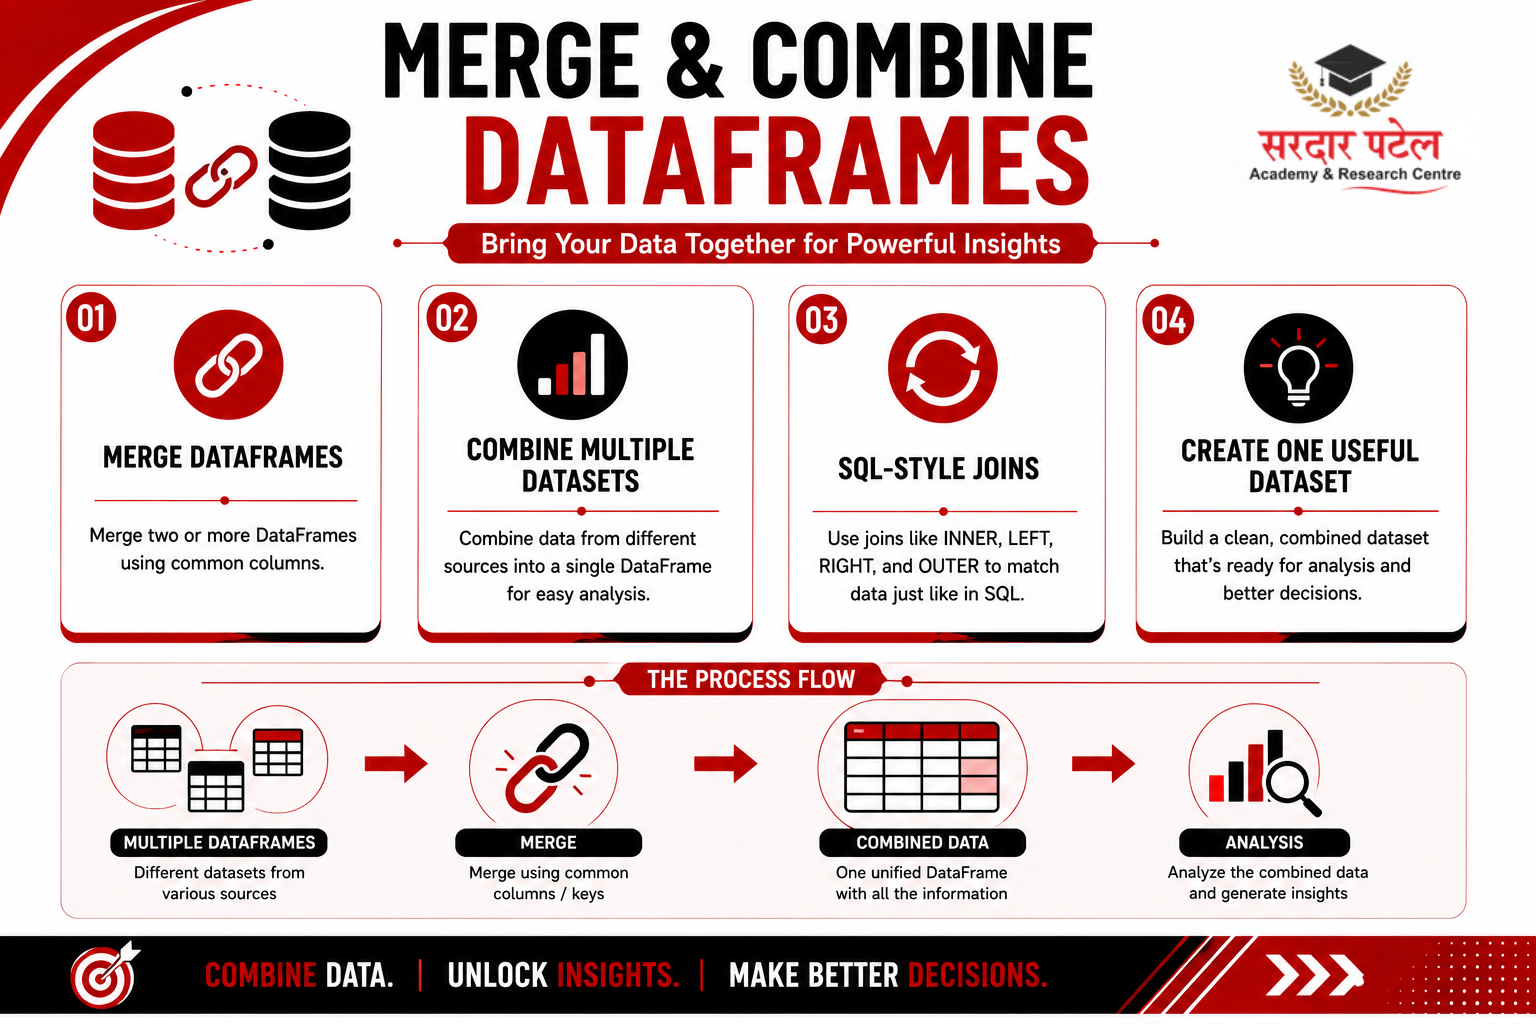
The how parameter controls how the merge behaves:
- "left" – Keep all rows from the first table
- "right" – Keep all rows from the second table
- "inner" – Keep only matching rows
- "outer" – Keep everything from both tables
This function alone can replace hours of manual VLOOKUP work in Excel. If you've used SQL before, this will feel familiar — merging in Pandas works a lot like SQL joins. Wondering which one to specialize in for your career? Our SQL vs Python for Analytics Career guide breaks down exactly that.
A Quick, Practical Example
Let's put a few of these ideas together. Imagine you have a small sales dataset and want to know which product performed best.
import pandas as pd
data = {
"Product": ["Laptop", "Mobile", "Tablet", "Laptop", "Mobile"],
"Region": ["North", "South", "North", "South", "North"],
"Sales": [15000, 22000, 8000, 17000, 19000]
}
df = pd.DataFrame(data)
# Total sales per product
summary = df.groupby("Product")["Sales"].sum().sort_values(ascending=False)
print(summary)
In just six lines, you've loaded data, grouped it, summed it, and sorted it by performance. That's the entire point of learning Pandas — turning raw numbers into a clear answer in seconds.
Common Mistakes Beginners Make
Forgetting inplace=
True — Many Pandas functions don't change your DataFrame unless you tell them to. Without inplace=True, you'll need to reassign the result: df = df.dropna(). That said, only use inplace=True directly on the full DataFrame or a full column reference — not on a chained selection like df["col"].method(inplace=True) — since that pattern is being phased out and won't reliably update your original data.
Ignoring data types —
A column of numbers stored as text won't sum correctly. Always check df.info() before running calculations.
Not checking for missing values early —
Missing data can silently break your analysis later. Run df.isnull().sum() right after loading any dataset.
Overusing loops —
Pandas is built for vectorised operations. Looping through rows one by one is slower and usually unnecessary.
Skipping .head() and .describe() —
Jumping straight into analysis without understanding your data first almost always leads to mistakes down the line.
Once these habits become second nature, the fastest way to lock them in is by practising on real, messy datasets — which is exactly what SPARC's Data Analytics Course with AI is built around.
Learn Pandas Practically, Not Just Theoretically
Reading is a good start, but nothing beats hands-on practice with real datasets and expert guidance. If you want structured, project-based training in Python, Pandas, SQL, Excel, and Power BI, explore SPARC's Data Analytics Course with AI — built for complete beginners, with live projects and placement support.
Visit Sardar Patel Academy & Research Centre (SPARC) to learn more and start turning raw data into real insights.
Conclusion
This Python pandas tutorial covered everything a beginner needs to start working with real data: installing Pandas, understanding Series and DataFrames, reading files, cleaning messy data, handling missing values, and summarising results with groupby().
Reading about Pandas will only take you so far. The real learning happens when you open a dataset of your own — even something as simple as your monthly expenses — and try to answer a question using the code from this guide. If you're a student looking to turn practical projects like this into a strong resume, check out our guide, "How Students Can Build a Data Analytics Portfolio."
Pandas is also one of the most in-demand skills employers look for, and it fits naturally into a broader data analytics learning path — one that can open doors to several career opportunities in analytics.
FAQs
No. If you know basic Python, Pandas is straightforward to pick up. Most people become comfortable with core functions like head(), groupby(), and loc within a few days of regular practice.
Yes, at least the basics — variables, lists, and simple functions. You don't need to be advanced, but understanding Python fundamentals makes learning Pandas for data analytics beginners much smoother.
NumPy handles numerical arrays and mathematical operations, while Pandas is built on top of NumPy and adds labeled rows, columns, and tools specifically for working with real-world, messy datasets.
Pandas comfortably handles datasets with millions of rows on a normal computer. For extremely large datasets, tools like Dask or PySpark are better suited, but Pandas covers the vast majority of everyday analytics work.
Pandas is used daily by data analysts, data scientists, and business analysts at companies of every size. It's a standard tool alongside SQL, Excel, and Power BI in most analytics job postings.
Once you're comfortable with Pandas, you can clean and analyze sales data, build reports, prepare data for machine learning models, or feed cleaned data into dashboards built with Power BI or Tableau.
With consistent practice, most beginners can handle basic to intermediate tasks — cleaning data, filtering, grouping — within two to four weeks. Real fluency comes from working on actual datasets, not just reading tutorials.