+91 9312966129
 sparc.enquiry01@gmail.com


Interview with Analytics Faculty
Read our analytics faculty interview with SPARC's Satish Sir — real teaching approach, course details, and expert analytics trainer advice for learners.
Table of Contents
- Why This Analytics Faculty Interview Matters for Learners
- Meet the Faculty: Satish Sir
- The Interview: Teaching Philosophy and Approach
- Q: What's the biggest gap you see between how analytics is taught in theory versus how it's applied on the job?
- Q: How do you approach teaching someone with zero technical background?
- Q: What mistakes do you see beginners make most often?
- Common Beginner Mistakes vs. Better Practice
- What Working Professionals Should Know
- Q: What should a working professional expect when switching into analytics from a non-technical role?
- Q: What's your expert analytics trainer advice for someone learning while working full-time?
- Advice for Business Owners
- Q: What should business owners in Delhi NCR understand about analytics, even without doing the hands-on work themselves?
- Inside SPARC's Data Analytics Course with AI
- Career Opportunities After the Course
- Why SPARC's Approach Stands Out
- Final Thoughts
If you've ever wondered what separates a data analytics course that just teaches software from one that builds real, job-ready thinking, the answer usually comes down to who's teaching it. That's exactly why we sat down for this analytics faculty interview with Satish Sir, Data Analytics Faculty at Sardar Patel Academy & Research Centre (SPARC), GTB Nagar, Delhi.
This isn't a generic “meet the teacher” piece. It's a practical conversation covering teaching approach, common learner struggles, and what actually helps students in Delhi NCR's competitive analytics job market — whether you're a complete beginner, a working professional switching careers, or a business owner trying to make sense of your own data.
By the end of this analytics faculty interview, you'll have a clearer picture of what SPARC's Data Analytics Course with AI actually involves, and what to look for before enrolling anywhere.
Why This Analytics Faculty Interview Matters for Learners
Most people choose a course based on the syllabus. Fewer people ask about the faculty — and that's a mistake. The syllabus tells you what will be covered. The faculty tells you how it will be taught and whether concepts will actually stick. For beginners who want to understand the broader role of a data analyst, the Microsoft Learn data analytics learning path provides an introduction to analytics processes, roles, and Power BI.
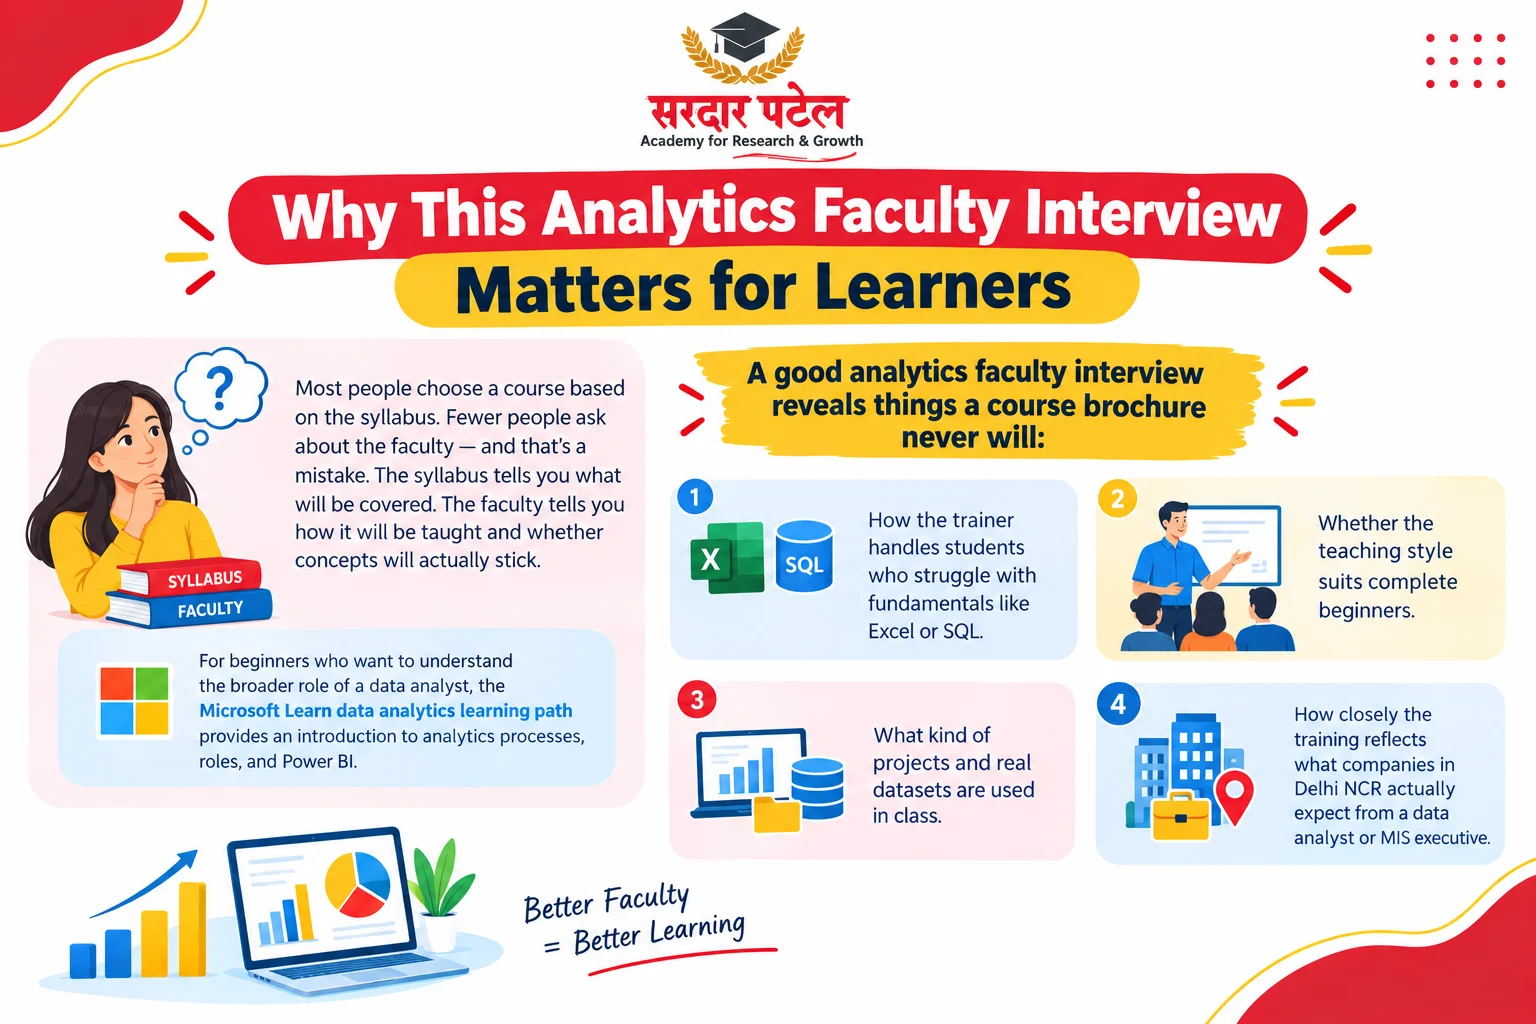 A good analytics faculty interview reveals things a course brochure never will:
- How the trainer handles students who struggle with fundamentals like Excel or SQL
- Whether the teaching style suits complete beginners
- What kind of projects and real datasets are used in class
- How closely the training reflects what companies in Delhi NCR actually expect from a data analyst or MIS executive
Meet the Faculty: Satish Sir
Satish Sir is SPARC's Data Analytics Faculty, with 3+ years of experience teaching data visualization, analytics tools, and industry-oriented practical training. He teaches as part of SPARC's Data Analytics Course with AI, an 8-month program covering Advanced Excel, SQL, Python, Power BI, Tableau, and modern AI tools through hands-on projects.
Multiple students who've completed the course describe his teaching style as simple and practical — one recent student noted that he “explains the concepts in a very simple and practical way, which makes even complex topics easy to understand.” Center Head Vanita Puri is frequently mentioned alongside him for guiding students through the program.
The Interview: Teaching Philosophy and Approach
Q: What's the biggest gap you see between how analytics is taught in theory versus how it's applied on the job?
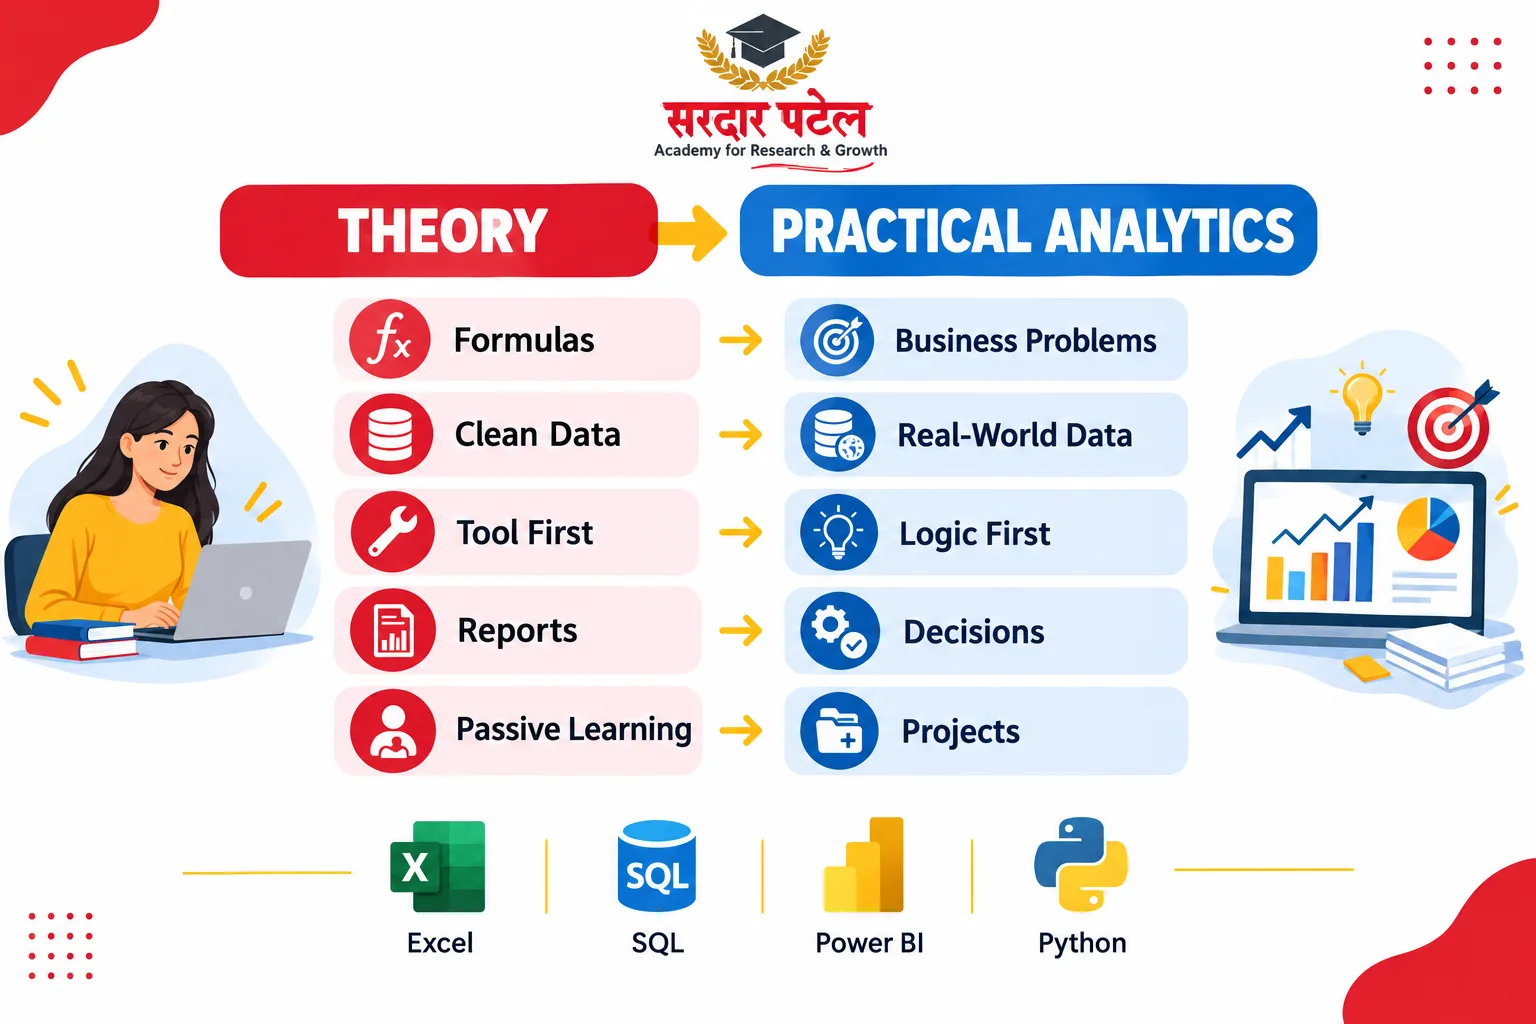
Students often learn formulas and functions in isolation, without connecting them to a real business question. In practice, analytics starts with a problem — falling sales, unclear inventory numbers, a messy customer list — and the tool comes second. That's why every module in our course is built around practical assignments and live projects instead of just concept-by-concept teaching.
Q: How do you approach teaching someone with zero technical background?
We don't start with software — we start with logic. A student needs to understand how to break a business problem into smaller questions before Excel, SQL, or Python make sense. Once that thinking is in place, tools like Advanced Excel or Power BI become much easier to pick up, because the student already knows what they're trying to achieve with each formula or dashboard.
Q: What mistakes do you see beginners make most often?
A few show up repeatedly in class:
- Rushing to advanced tools like Python or Power BI before getting comfortable with Advanced Excel basics.
- Memorizing formulas instead of understanding when and why to use them.
- Skipping data cleaning — assuming real datasets will be as neat as classroom examples.
- Not connecting analysis to a decision — running a report without asking “what should this change?”
 Common Beginner Mistakes vs. Better Practice
| Common Mistake |
Better Practice |
| Jumping to Python/Power BI too early |
Building strong Advanced Excel and SQL fundamentals first |
| Memorizing formulas |
Understanding the business logic behind each function |
| Practicing only with clean sample data |
Working with real-world, messier datasets |
| Treating each module separately |
Connecting every tool to a business scenario |
| Learning passively |
Completing project-based assignments consistently |
What Working Professionals Should Know
Q: What should a working professional expect when switching into analytics from a non-technical role?
Expect a gradual build, not an overnight change. Professionals coming from sales, operations, or accounting often already understand business context — that's a real advantage. What they usually need is consistent hands-on practice with tools like SQL and Power BI to build technical confidence alongside that experience. Those building their Power BI skills alongside work can also use Microsoft's Power BI learning resources to strengthen their understanding of data connections, cleaning, modelling, visualization, and reporting.
Q: What's your expert analytics trainer advice for someone learning while working full-time?
Consistency matters more than long study sessions. SPARC's Class Status Sheet (CSS) system helps here — every class has a clear plan of what's being taught, so even if a student can only attend part-time, they know exactly what to revise using the mobile app and study material afterward.
Advice for Business Owners
Q: What should business owners in Delhi NCR understand about analytics, even without doing the hands-on work themselves?
You don't need to become a data analyst to benefit from analytics literacy. Understanding what a dashboard is telling you, and knowing what questions to ask your MIS or reporting team, is valuable on its own. Many small businesses across Delhi NCR already have sales, inventory, or customer data — they just haven't set up a simple, consistent way to look at it.
Inside SPARC's Data Analytics Course with AI
Based on this analytics faculty interview, here's what the program actually covers:
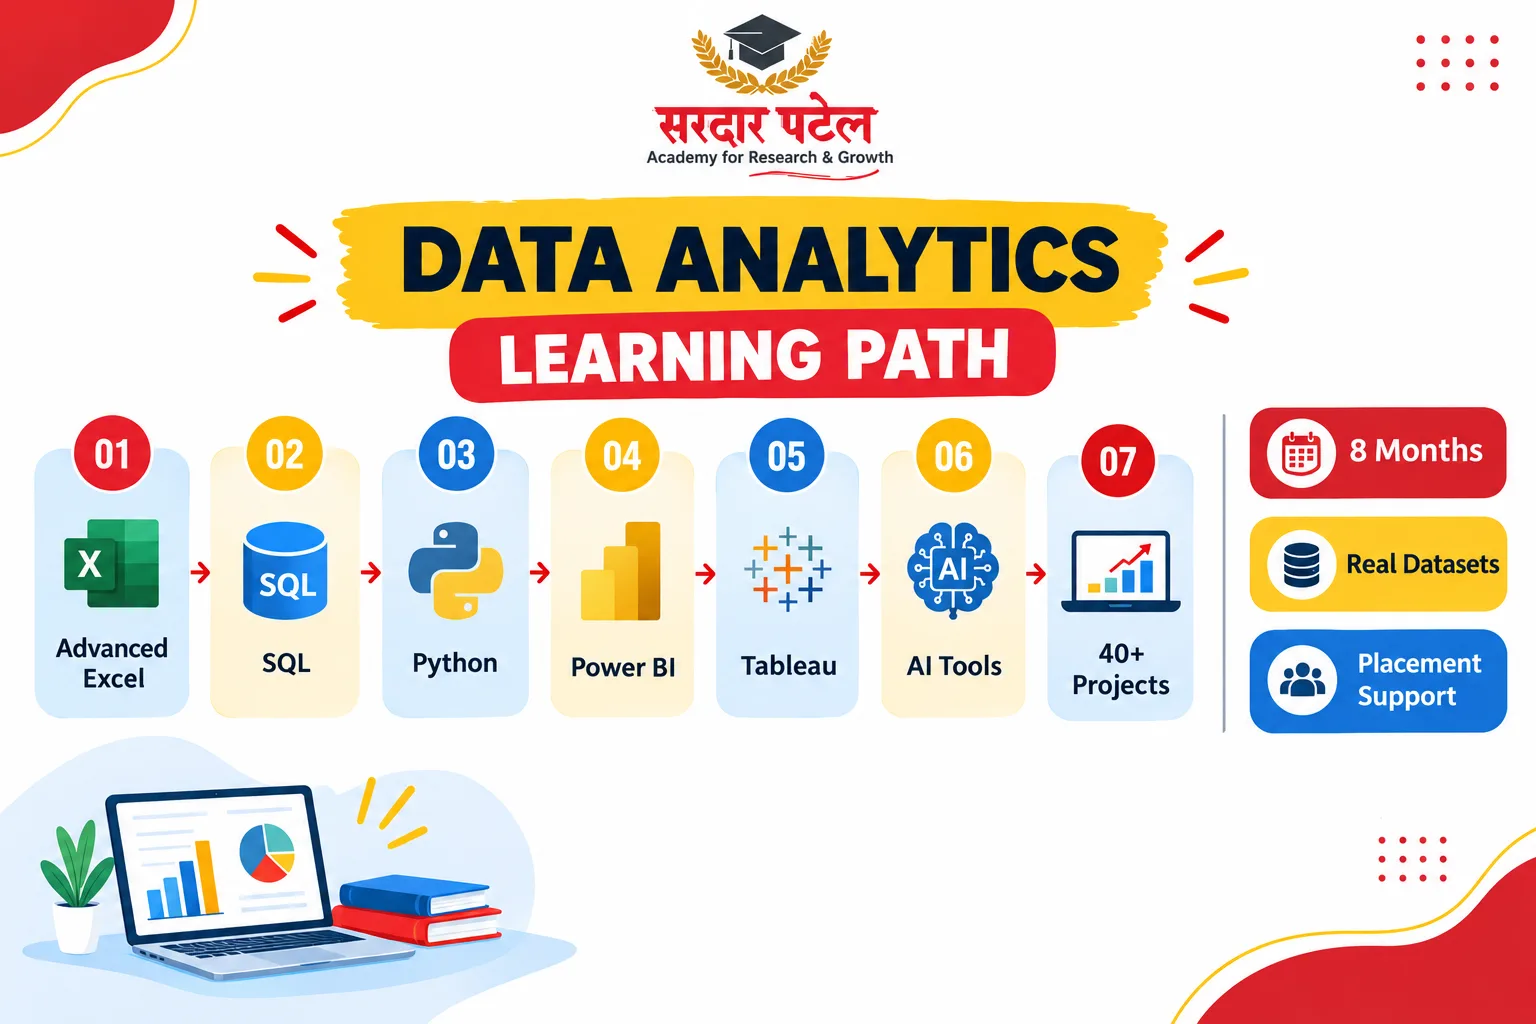
- Duration: 8 months, structured from basic to advanced level
- Tools covered: Advanced Excel, SQL, Python, Power BI, Tableau, and modern AI tools. Learners who want to explore the visualization tool further can refer to the official Microsoft Power BI overview, which explains how Power BI connects data, creates interactive reports, and supports data-driven insights.
- Format: Project-based training with 40+ projects and real-world datasets. Students can also explore the Student Portfolio Showcase to see how practical analytics projects can be presented as part of a job-ready portfolio.
- Support systems: CSS-based class tracking, a dedicated mobile app for assignments and study material, and placement support including resume building, mock interviews, and job assistance
- Eligibility: No strict educational requirement — open to Class 12th students (via the ADCA with Data Analytics course), graduates, and working professionals
The course is taught at SPARC's GTB Nagar campus (Hudson Lane, Kingsway Camp, near GTB Nagar Metro Station, Gate No. 4) — a location easily accessible for students across Delhi's North Campus area.
Career Opportunities After the Course
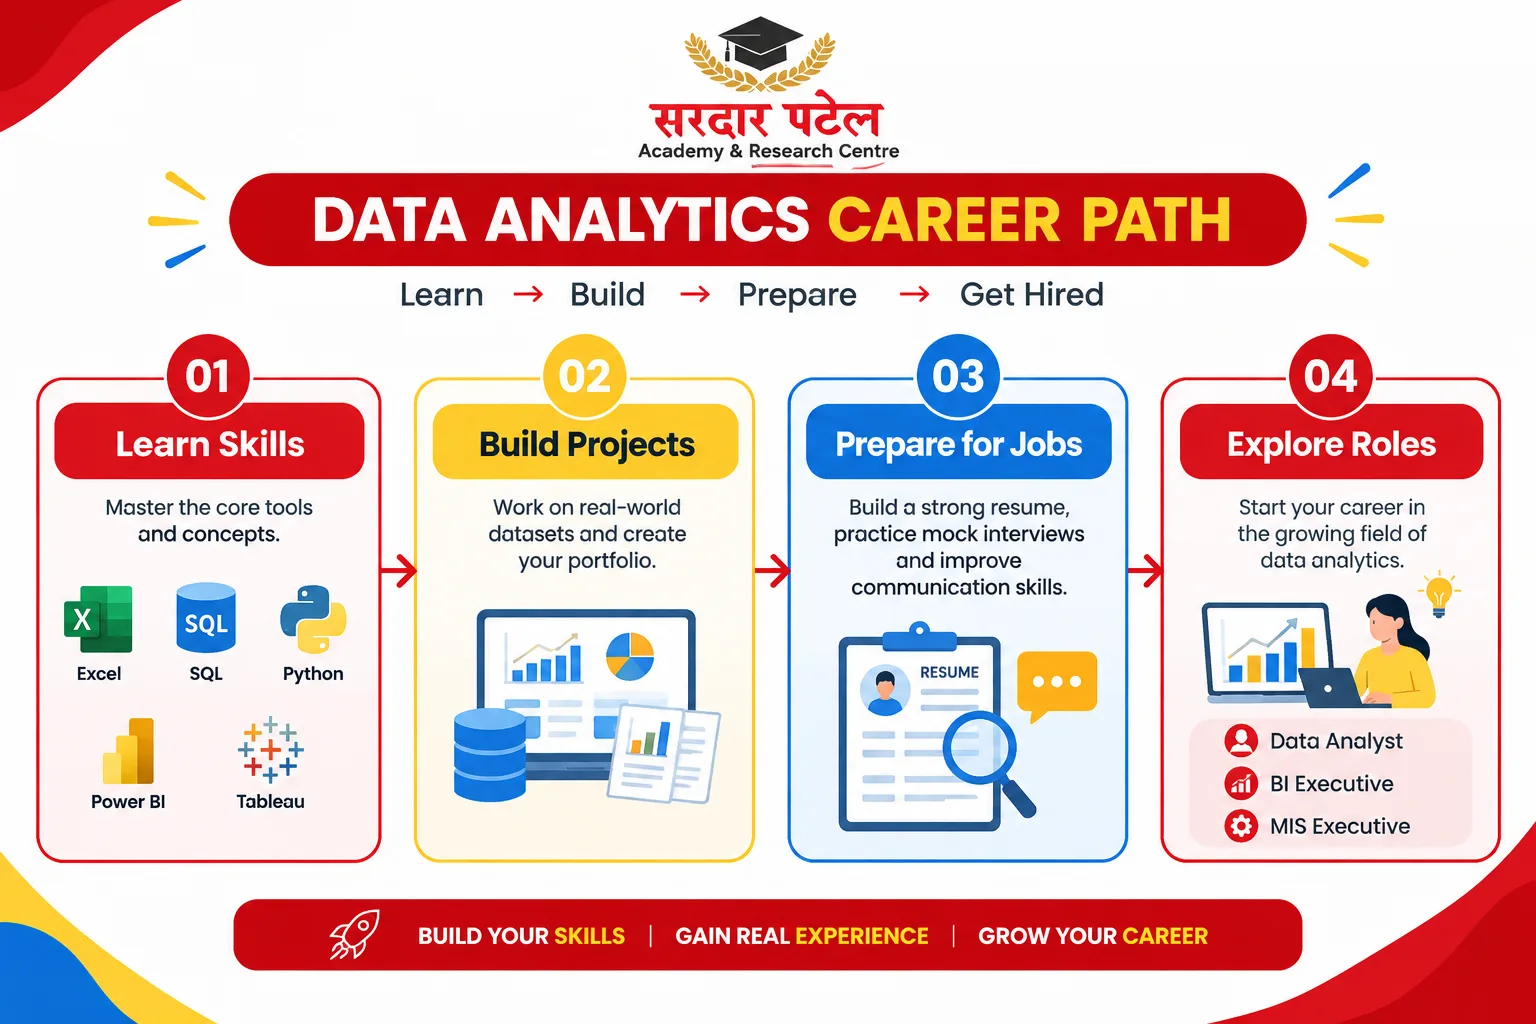
Graduates typically move toward roles in Data Analytics, Business Intelligence, and MIS Reporting. To understand how analytics skills are used in professional roles, learners can also explore IBM's data and analytics career roles, including positions such as Data Analyst and Data Scientist.
Recent placement listings on SPARC's own job board have included roles like MIS cum Data Analyst Trainee and MIS Executive positions across Delhi NCR locations such as Rajouri Garden and Ashok Vihar.
If placement support is an important factor in your decision, you can also explore the Best Data Analytics Course in Delhi with a placement guide for more information. For a deeper look at tool choices in this field, SPARC's blog comparison on Power BI vs Tableau is a useful next read, and their roundup of free data analytics tools is worth checking before you decide which paid tools are actually worth learning first.
Why SPARC's Approach Stands Out
SPARC has operated as a No Profit – No Loss self-finance NGO since 2003, and currently reports 23+ years of institutional experience, 50,000+ students trained, and 15,000+ students placed across its network. It's an ISO 9001:2015 certified institute and a government-authorized NIELIT CCC centre, with branches across GTB Nagar (flagship), Rani Bagh, North Campus-2, Janak Puri, Nangloi, Dwarka Mor, and Najafgarh.
For learners comparing different training options, this Data Analytics Certification Courses in Delhi Guide can provide additional context on what to consider before choosing a program.
Final Thoughts
This analytics faculty interview reinforces a simple point: good analytics training isn't about covering the most tools — it's about building the thinking behind them. Whether you're a student, a professional switching careers, or a business owner trying to read your own numbers better, SPARC's approach under faculty like Satish Sir focuses on practical, project-based learning over theory-heavy teaching.
If this conversation resonated with you, it's worth exploring the program firsthand. Learn under experts at Sardar Patel Academy & Research Centre (SPARC) at the GTB Nagar campus, and reach out to know more about the Data Analytics Course with AI and how it fits your goals.
FAQs
Satish Sir, SPARC's Data Analytics Faculty with 3+ years of experience in analytics tools and industry-oriented practical training, is the primary instructor for this program.
No. The course is designed to take students from a basic to an advanced level, starting with fundamentals like Advanced Excel before moving to SQL, Python, Power BI, and Tableau.
The Data Analytics Course with AI is an 8-month program.
Yes, SPARC offers placement support including resume building, mock interviews, communication skills training, and job assistance connecting students with hiring companies.
Yes. The course structure, including the mobile app and CSS-based class tracking, is designed to help students keep up even with limited weekly hours.
At SPARC's GTB Nagar campus in North Delhi, near GTB Nagar Metro Station, with additional branches across Delhi NCR.
Common roles include Data Analyst, Business Intelligence Executive, and MIS Executive/Reporting roles.