+91 9312966129
 sparc.enquiry01@gmail.com



How to Check Whether AI-Generated Data Insights Are Correct
Learn how to validate AI data analysis with a 7-step checklist. Spot AI hallucinations, verify AI insights and data accuracy before you share results.

Table of Contents
- Why AI Insights Can Look Right and Still Be Wrong
- A 7-Step Checklist to Validate AI Data Analysis
- Step 1: Confirm the data was read correctly
- Step 2: Recalculate the key numbers yourself
- Step 3: Ask to see the method
- Step 4: Check definitions and scope
- Step 5: Test for statistical traps
- Step 6: Compare against a trusted baseline
- Step 7: Record what you verified
- Prompts to Ask Before Trusting an Answer
- A Worked Example
- Validation Log Template
- Tools That Help You Verify AI Insights
- Common Mistakes When You Verify AI Insights
- Why This Skill Matters for Your Career
- Conclusion
Ask an AI assistant to analyse a sales file, and you’ll get tidy charts and a confident summary within seconds. What you won’t get is any guarantee that the summary is true. Before those findings reach a dashboard or a client presentation, you need a habit of checking them.
This guide shows you how to validate AI data analysis systematically. You’ll see where AI-generated insights usually fail, a seven-step checklist, ready-to-use prompts, a validation log template and the tools that make verification faster.
Why AI Insights Can Look Right and Still Be Wrong
Language models are built to produce fluent, believable text, not to guarantee arithmetic. That is why AI hallucinations in analytics are so hard to catch: a wrong answer reads exactly like a right one. A model may invent a column name, apply a filter you never asked for, or describe a trend that isn’t in your data at all.
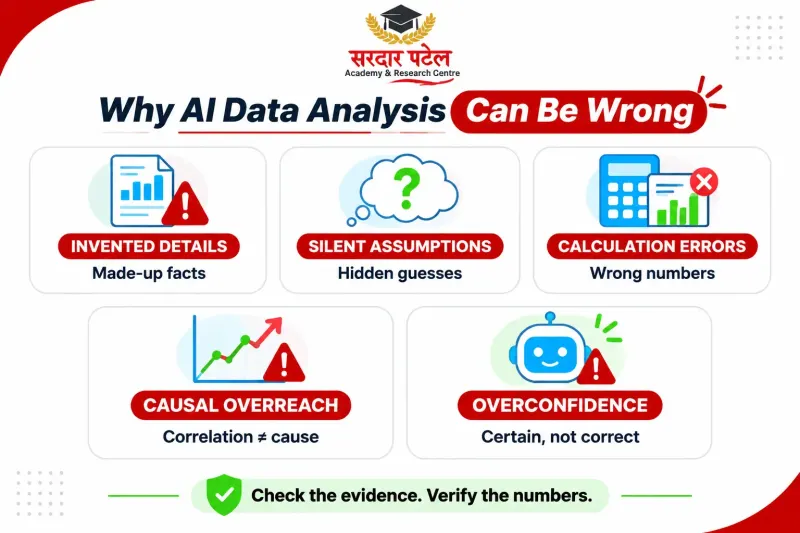
The wider problem is explained well in IBM’s explainer on AI hallucinations. Most errors in analysis fall into a handful of patterns:
| Failure type |
What it looks like |
Example |
| Invented details |
Fields, figures or sources that don’t exist |
A summary cites a “churn score” column your file never had |
| Silent assumptions |
Hidden filters, date ranges or currencies |
Revenue covers only the latest quarter, but the text says “this year” |
Calculation slips |
Wrong totals, averages or percentages |
Averaging regional percentages instead of weighting by volume |
| Causal overreach |
Correlation presented as cause |
“The discount reduced churn” with no supporting test |
Overconfidence |
Weak evidence stated as fact |
A trend drawn from twelve rows |
Careful teams treat every output as a first draft, never as a finished answer. Knowing these patterns tells you where to look first.
A 7-Step Checklist to Validate AI Data Analysis
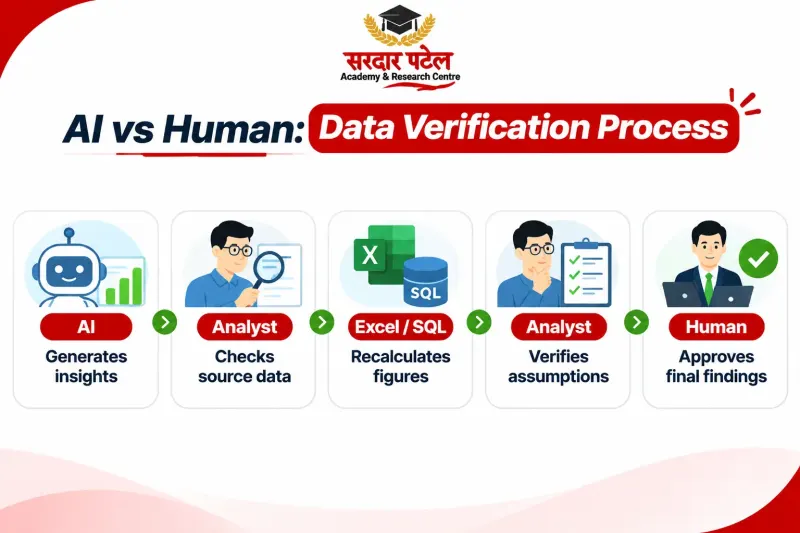
The value of a checklist is consistency. When you run the same checks every time, you stop relying on instinct, which is exactly what a polished AI answer is good at fooling.
Step 1: Confirm the data was read correctly
Ask the AI to state the row count, column names, data types and date range it used, then compare them with your file. Duplicates, blanks and mixed formats corrupt everything downstream, so data accuracy begins here. For fixes, see our guide to AI data cleaning.
Step 2: Recalculate the key numbers yourself
Pick three to five headline figures and reproduce them in Excel, SQL, Python or Power BI. This single habit catches most calculation slips in minutes. If you can’t match a number, don’t publish it.
For repeatable checks, a script beats a spreadsheet, and Python vs R helps you pick the language.
Step 3: Ask to see the method
Request the formula, query or code behind each claim, then read it. Check joins, filters, grouping and how null values were handled.
The pandas guide to handling missing data shows what correct treatment looks like. An answer with no visible method cannot be audited.
Step 4: Check definitions and scope
Does “active customer” mean what your business means by it? Is revenue gross or net? Many wrong insights are correct answers to the wrong question. Write your definitions down before you prompt, ideally in a semantic layer.
Step 5: Test for statistical traps
Look at sample size, outliers and segment effects. A trend in combined data can reverse inside every subgroup, a pattern known as Simpson’s paradox. Before accepting a cause-and-effect claim, ask what else could explain it.
Step 6: Compare against a trusted baseline
Match the output with last quarter’s report, finance figures or what your team already knows. An insight that contradicts everything you know deserves extra scrutiny, not automatic belief. BI summaries, including Power BI Copilot, need the same human review.
Step 7: Record what you verified
Write a short note covering what was checked, how, and by whom. It builds trust with stakeholders and lets anyone repeat the checks later.
Prompts to Ask Before Trusting an Answer
Paste these at the start of a session to validate AI data analysis before you rely on it.
- “State the row count, column names and date range you used.”
- “Show the formula, SQL query or code behind each number.”
- “List every filter and assumption you applied.”
- “Which of these claims are correlation, and which are tested causation?”
- “What would change this conclusion?”
- “Which figures are you least certain about?”
A Worked Example
Suppose an AI tool reports that “orders in the north region grew 40%.” Recalculating shows a different story:
| Period |
Orders (illustrative) |
What the AI said |
What the check showed |
| Month 1 |
1,000 |
“Grew 40%” |
Baseline month |
| Month 2 (promotion) |
1,400 |
— |
Spike from a one-off promotion |
| Month 3 |
1,000 |
— |
Back to baseline, so the quarter is flat |
The tool wasn’t wrong so much as selective: it picked a convenient window. Steps 4 and 6 would have exposed it. A sensible-looking result still needs a check.
Validation Log Template
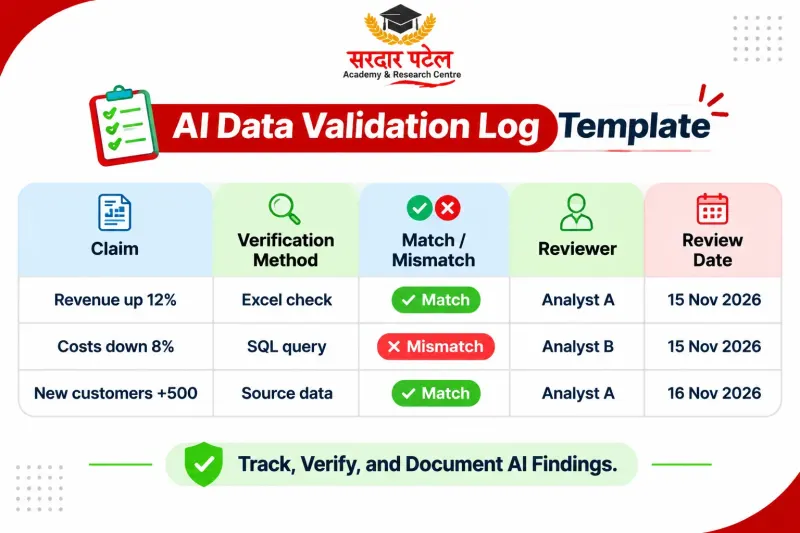
A shared log keeps reviews consistent across a team. Copy this into a sheet and fill one row per claim:
| Claim |
Method used to check |
Result (match / mismatch) |
Reviewer and date |
| North region grew 40% |
Monthly SQL recount |
Mismatch: promo month only |
Name, 12 Nov |
Tools That Help You Verify AI Insights
Assistants such as ChatGPT, Microsoft Copilot and Google Gemini are fast drafting partners. Use conventional tools as an independent check. To validate AI data analysis at scale, combine a few simple methods:
- Pivot tables for quick reconciliation of totals
- SQL queries for row counts, duplicates and aggregates
- Python or R notebooks for repeatable, documented tests
- A shared validation log so reviews don’t depend on memory
For what each category does well, see our overview of AI tools for analysts.
Common Mistakes When You Verify AI Insights
Most failures to validate AI data analysis come from skipping steps, not from lacking skill.
- Trusting a chart because it looks polished. Design is not evidence.
- Checking only the final answer. Errors usually start in the data.
- Asking the same AI to grade its own work. Use an independent method.
- Accepting unexplained numbers. No method means no proof.
- Skipping documentation. Undocumented checks can’t be repeated or defended.
- Uploading sensitive data carelessly. Follow your organisation’s data policy first.
Organisations are also formalising this discipline. The NIST AI Risk Management Framework is useful background if you’re setting team-wide rules.
Why This Skill Matters for Your Career
Employers don’t only need people who can prompt a tool; they need people who can tell when it’s wrong. That takes SQL and spreadsheet fluency for recalculation, statistics basics, domain knowledge and clear documentation. Someone who can validate AI data analysis is trusted with decisions, not just tools. To see how the two roles differ, read AI Data Analyst vs Data Analyst.
Conclusion
AI makes analysis faster, but speed without checking just produces wrong answers sooner. A consistent process to validate AI data analysis, covering source data, independent recalculation, definitions, statistical traps and documentation, protects both your credibility and your decisions.
Start with one project this week and run the seven steps. When you’re ready to go deeper, the Data Analytics Course with AI at SPARC runs for 8 months with 40+ projects across Excel, SQL, Python, Power BI, Tableau and AI tools, and treats AI as a tool to be checked, never simply trusted.
FAQs
Recompute three to five headline numbers independently and compare them with a trusted baseline. That alone catches most serious errors.
It’s useful for drafting queries and spotting patterns, but it can invent details or slip on calculations. Treat its output as a draft and verify it before use.
They’re confident outputs not supported by your data, such as invented columns, fabricated figures or trends that don’t exist.
It can flag possible issues, but you still need an independent method, like SQL or a spreadsheet recalculation, to confirm results properly.
Start with the figures that drive decisions: totals, growth rates, averages and any claim of cause and effect.
No. Clean data improves data accuracy, but the AI can still misuse filters, definitions or calculations.
Every time the output informs a decision, a report or a client deliverable.