+91 9312966129
 sparc.enquiry01@gmail.com


Python Basics for Data Analytics
Learn Python for data analytics with this free, hands-on beginner tutorial — real code examples, practice exercises, and a mini project included.
Table of Contents
- What Is Python for Data Analytics?
- Data analysts commonly use Python for:
- Saves Time Through Automation
- Handles Large Datasets
- A Rich Ecosystem of Libraries
- How to Install Python and Set Up Your Environment
- Step 1: Download Python
- Step 2: Install Visual Studio Code (VS Code)
- Step 3: Install the Python Extension
- Step 4: Verify the Installation
- Writing Your First Python Program
- Python Fundamentals Every Beginner Should Learn
- Variables
- Data Types
- Operators
- Lists, Tuples, and Dictionaries
- Conditional Statements and Loops
- Functions
- File Handling and Comments
- Essential Python Libraries for Data Analytics
- Mini Project: Analyse Your First Dataset with Pandas
- The Real-World Data Analytics Workflow
- Beginner-Friendly Python Analytics Projects
- Practice Exercises
- Common Mistakes Beginners Should Avoid
- Career Opportunities After Learning Python
- Learn Python Analytics with SPARC
- Conclusion
Data has become one of the most valuable assets for businesses worldwide. Companies use data to understand customer behaviour, improve operations, predict future trends, and make informed decisions. To work with this data efficiently, professionals need a programming language that is powerful, easy to learn, and widely used. That's where Python comes in.
If you're searching for a complete, practical guide to learning Python for data analytics, you've come to the right place. Python has become the dominant language in this space because of its simple syntax, flexibility, and an enormous collection of libraries built specifically for working with data. Whether you're a student, a working professional, or someone planning a career switch, learning Python opens doors into analytics, business intelligence, and data science roles.
This guide walks complete beginners through Python fundamentals, environment setup, and a real mini data analytics project. By the end, you'll understand why Python is the preferred language for data analysts, how to set up your environment, and how to write and run your first programs with confidence.
Unlike many tutorials that stop at theory, this guide pairs every concept with a working code example you can run yourself. You don't need any prior programming experience — just a willingness to type out the examples, make small mistakes, and learn from them as you go.
What Is Python for Data Analytics?
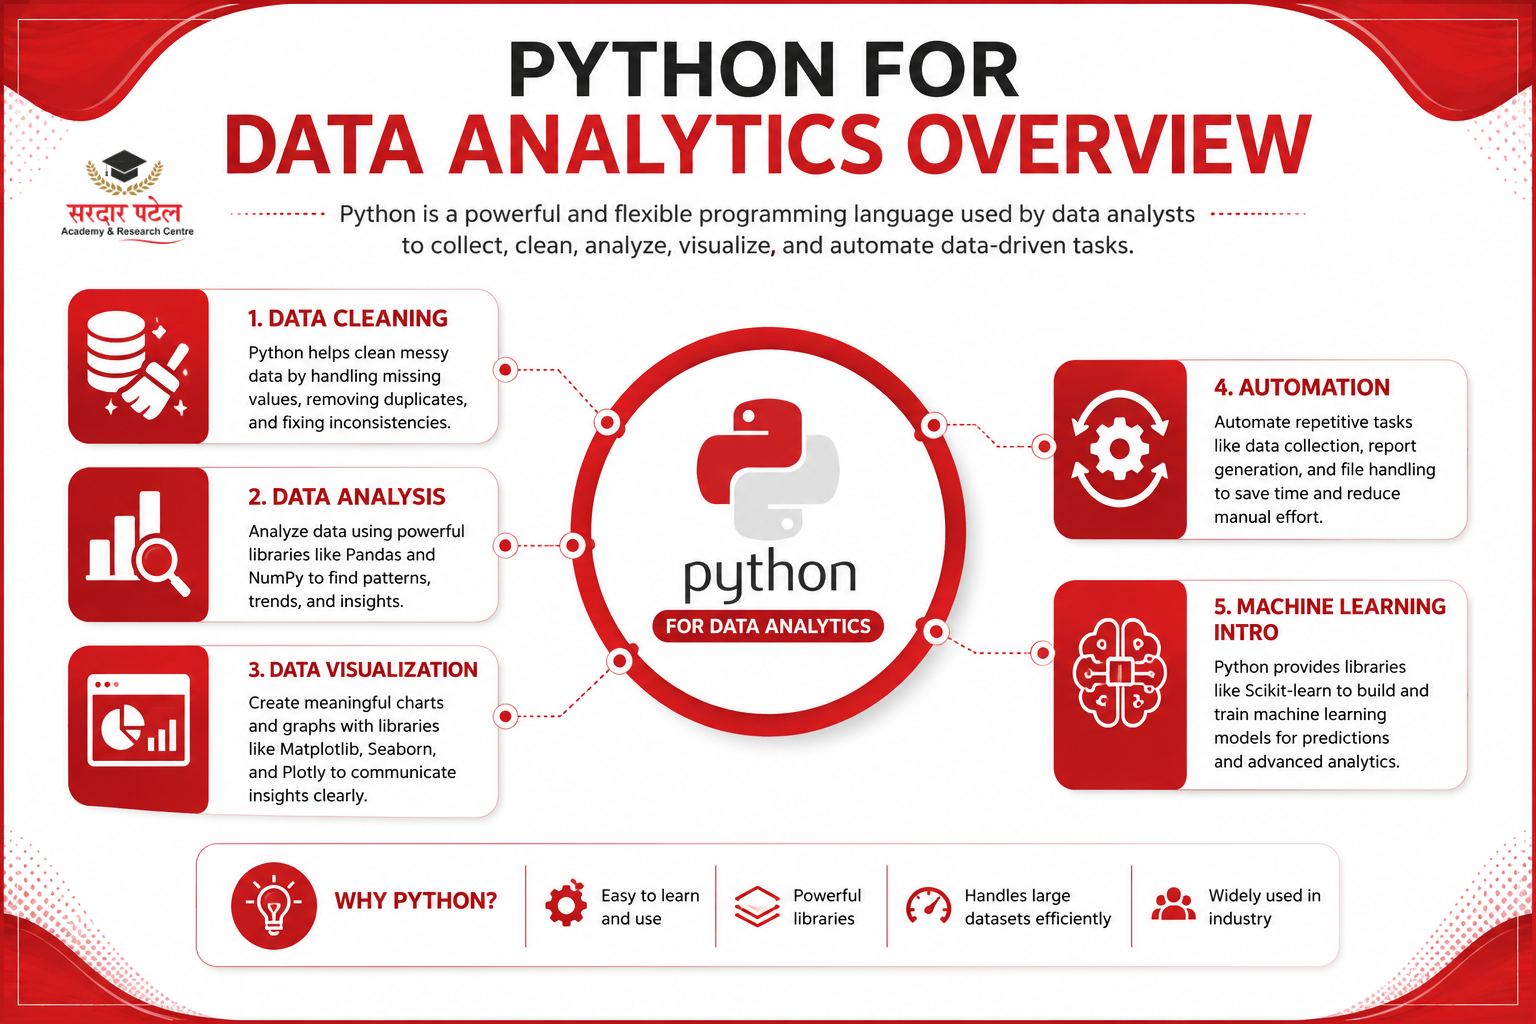
Python is a high-level, open-source programming language used to collect, clean, analyse, visualise, and automate data-related tasks. It allows analysts to process large datasets quickly while reducing manual effort.
Instead of spending hours performing repetitive tasks in spreadsheets, Python helps automate these processes with just a few lines of code. A task that might take an analyst an hour in Excel — like cleaning ten thousand rows of inconsistent data — can often be done in a few seconds with the right script.
Unlike spreadsheet software, Python is also fully reusable. Once you write a script to clean and summarise a sales report, you can run that same script every month on new data without redoing any manual work — something that's simply not practical with point-and-click tools alone.
Data analysts commonly use Python for:
- Cleaning messy datasets
- Performing statistical analysis
- Creating reports
- Building dashboards
- Visualising trends
- Automating repetitive tasks
- Preparing data for machine learning
Startups, multinational companies, financial institutions, healthcare organisations, and government agencies all rely on Python because of its speed, flexibility, and scalability across both small projects and enterprise-level systems.
Related Read: What Is Data Analytics? Beginner Guide
Why Data Analysts Choose Python Over Other Tools: Easy to Learn
Python's syntax is clean and readable, which makes it noticeably easier to pick up than many older programming languages like Java or C++. Consider this simple line:
print("Hello, Data Analytics!")
Even someone with zero programming background can guess what this code does just by reading it — it displays the text on screen. This readability is exactly why most data analytics courses start with Python rather than a more complex language.
Saves Time Through Automation
Many data analysis tasks involve repetitive work: removing duplicate records, cleaning missing values, combining multiple files, formatting dates consistently, and generating recurring reports. Python automates all of this, often turning hours of manual work into a script that runs in seconds.
Handles Large Datasets
Excel works fine for small datasets but slows down significantly with very large files. Python comfortably processes sales data, customer records, financial data, website traffic logs, and survey responses without performance issues, making it a far more scalable option for growing businesses.
A Rich Ecosystem of Libraries
Python's biggest strength is its libraries, which turn complex data tasks into simple, reusable commands:
| Library |
Purpose |
| Pandas |
Data cleaning and analysis |
| NumPy |
Numerical computing |
| Matplotlib |
Data visualization |
| Seaborn |
Statistical charts |
| Plotly |
Interactive dashboards |
| Scikit-learn |
Machine learning |
Strong Career Opportunities
Python skills are in high demand for roles such as Data Analyst, Business Analyst, Python Developer, Data Scientist, Machine Learning Engineer, and Business Intelligence Analyst.
How to Install Python and Set Up Your Environment
Step 1: Download Python
Visit the official Python website (python.org) and download the latest stable version for your operating system. During installation, check the box that says "Add Python to PATH" — this lets you run Python directly from the command prompt.
Step 2: Install Visual Studio Code (VS Code)
VS Code is one of the most widely used code editors for Python. It offers syntax highlighting, auto-completion, a built-in terminal, error detection, and Python-specific extensions, all of which make coding noticeably easier.
Step 3: Install the Python Extension
Open VS Code, go to the Extensions marketplace, and install the official Python extension. This adds intelligent code suggestions and debugging tools to your editor.
Step 4: Verify the Installation
Open Command Prompt or Terminal and type:
python --version
If installed correctly, you'll see output similar to Python 3. x.x. Your system is now ready for Python programming.
Writing Your First Python Program
Create a new file named hello.py and write the following:
print("Welcome to Python Data Analytics!")
Run the file, and you should see this output:
Welcome to Python Data Analytics!
That's your first working Python program.
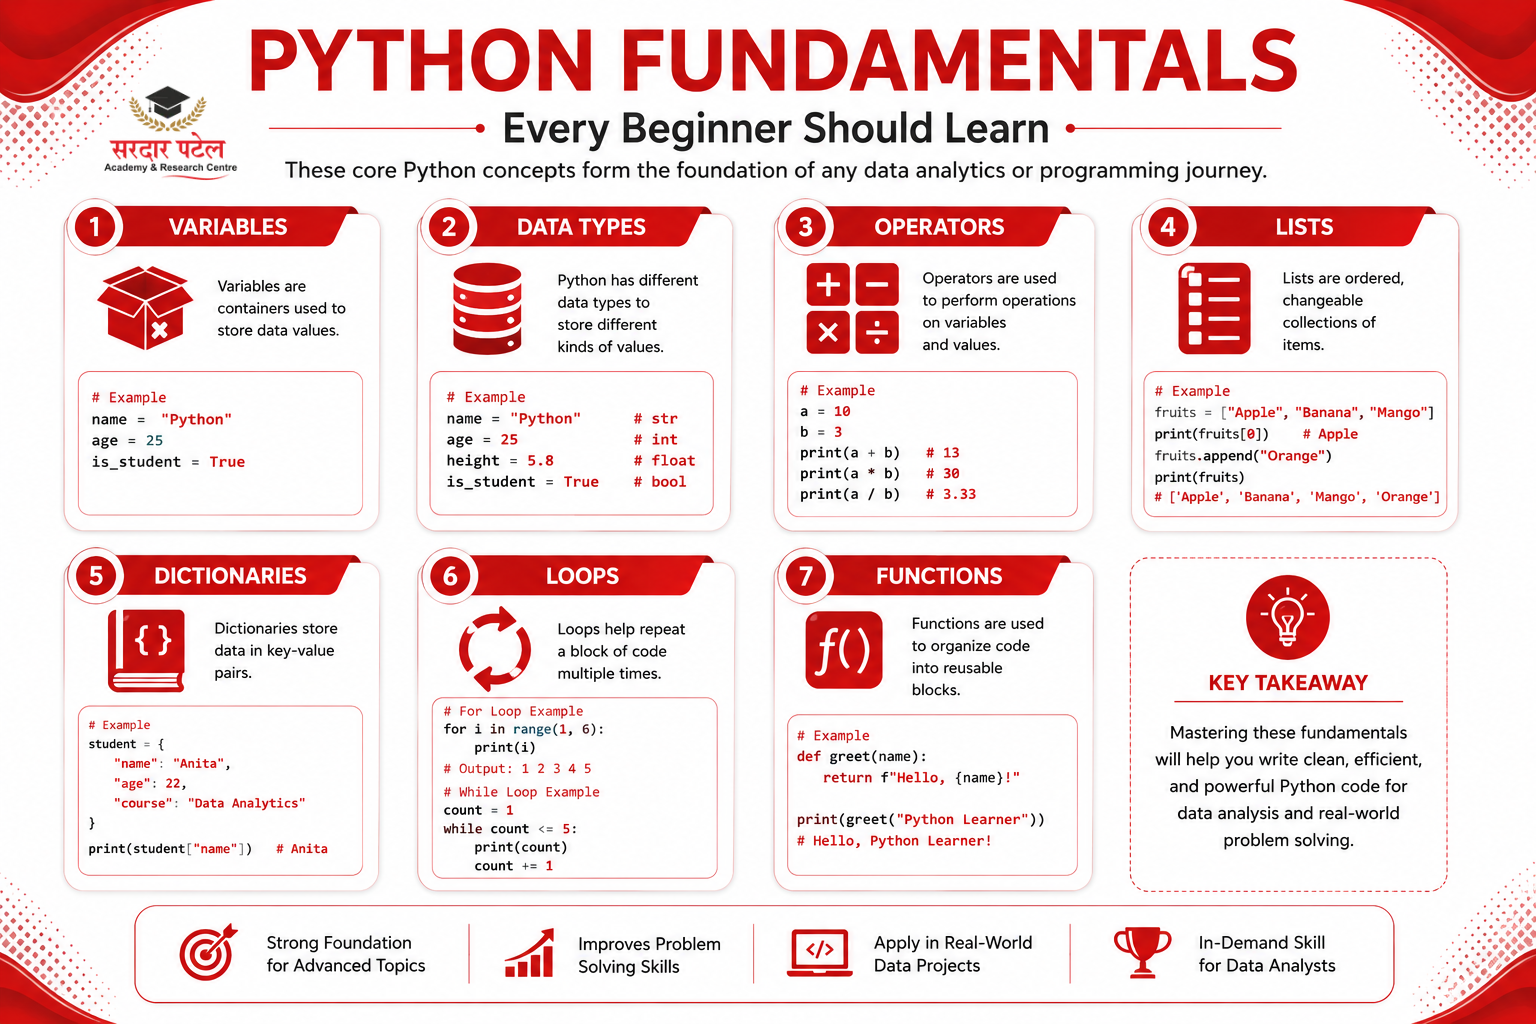
Python Fundamentals Every Beginner Should Learn
Variables
A variable is a container used to store data, so you don't have to retype the same value repeatedly.
student_name = "John"
age = 22
course = "Data Analytics"
Use meaningful names like student_name or monthly_sales instead of vague ones like a or x1 — this makes your code far easier to read later.
Data Types
| Data Type |
Example |
| Integer |
25 |
| Float |
95.8 |
| String |
"Python" |
| Boolean |
True |
Choosing the correct data type ensures your calculations behave the way you expect.
Operators
Arithmetic operators perform calculations: +, -, *, /. Comparison operators (>, ==, !=) are especially useful for filtering data and applying business rules.
Lists, Tuples, and Dictionaries
Lists store multiple values inside a single variable and are commonly used for sales figures, marks, or prices:
marks = [78, 82, 91, 88, 95]
print(marks[0])
print(marks[-1])
Tuples work like lists but cannot be changed after creation, making them useful for fixed values. Dictionaries store data as key-value pairs and are especially common when working with APIs and JSON data:
student = {"Name": "Rahul", "Age": 21, "Course": "Data Analytics"}
print(student["Name"])
Conditional Statements and Loops
Conditional statements let a program make decisions, while loops let it repeat actions across large datasets:
if marks >= 80:
print("Excellent")
else:
print("Keep Practicing")
Functions
Functions group reusable code into a single block, which keeps your scripts organised and reduces repetition:
def square(number):
return number * number
print(square(8))
File Handling and Comments
Most analysts work with external CSV or TXT files, which Python reads and writes easily using the open() function. Comments, written with a hash symbol or triple quotes, explain your code and make it easier to maintain — especially on team projects.
Essential Python Libraries for Data Analytics
Pandas simplifies data cleaning and manipulation, including reading CSV files, removing duplicates, handling missing values, and building reports. NumPy provides fast numerical computing for arrays and statistical calculations. Matplotlib and Seaborn create charts such as line, bar, and heatmaps, while Plotly enables interactive dashboards that businesses often use for executive reporting.
Related Read: Python Pandas Tutorial
Mini Project: Analyse Your First Dataset with Pandas
This short walkthrough applies what you've learned to a real analytics task.
import pandas as pd
data = pd.read_csv("sales_data.csv")
print(data.head())
print(data.info())
print(data.describe())
This five-step workflow previews the dataset, checks its structure, and generates summary statistics like average, minimum, maximum, and standard deviation — all in seconds, far faster than scrolling through a spreadsheet manually.
The Real-World Data Analytics Workflow
Professional analysts generally follow this five-step process:
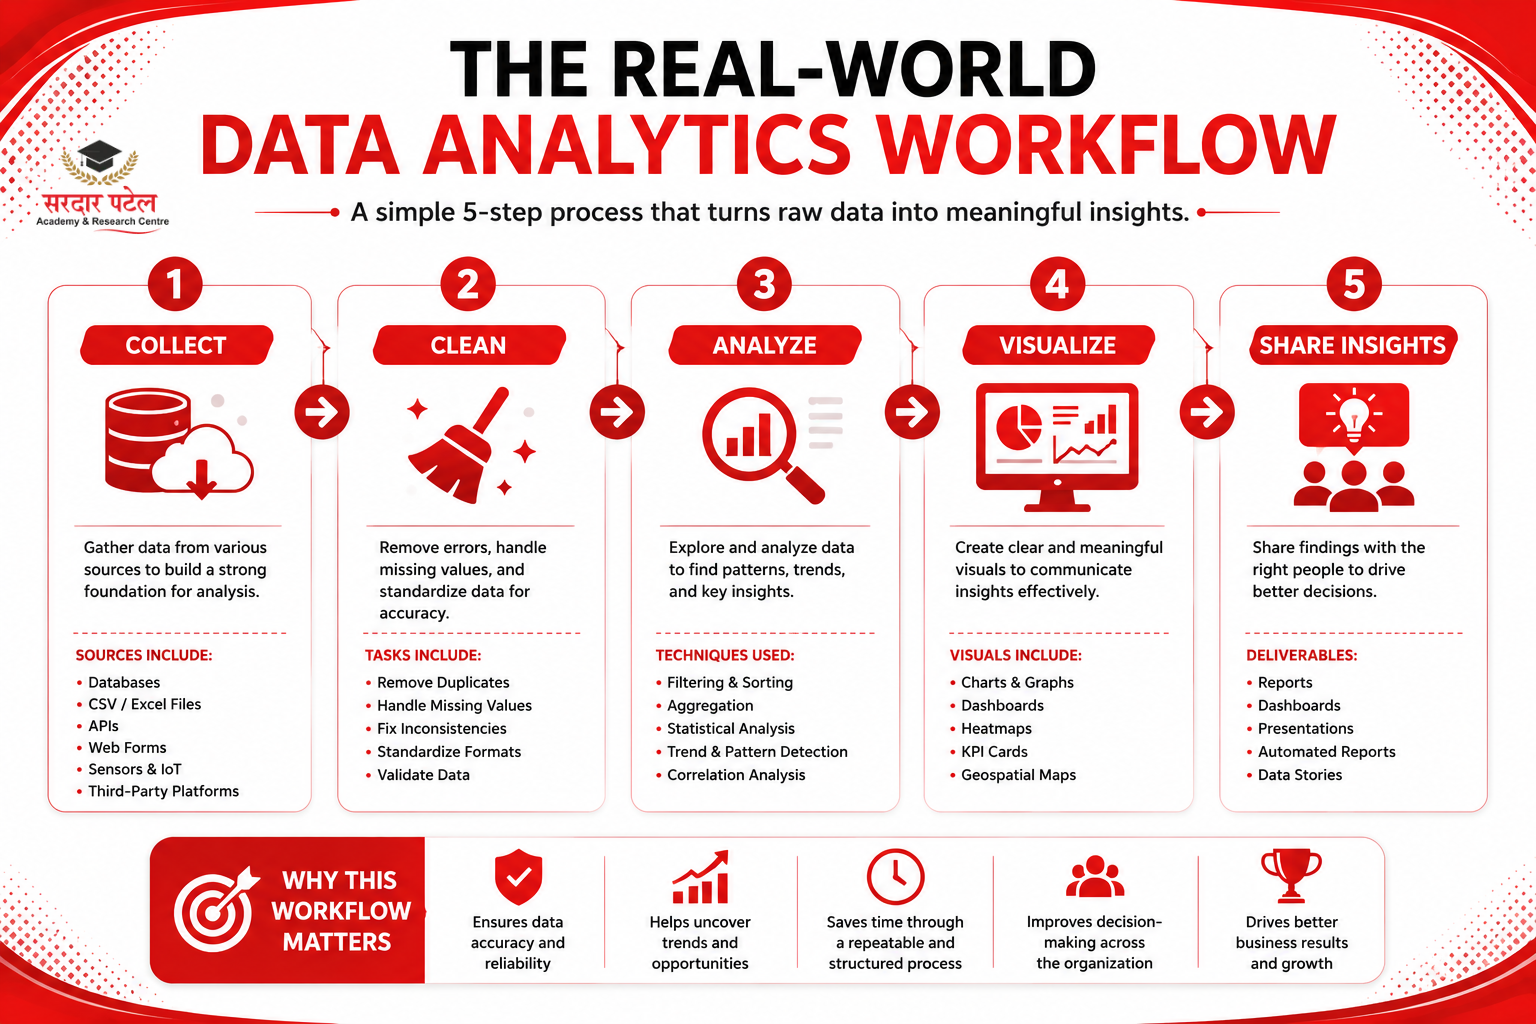
- Collect Data — from CSV files, Excel sheets, SQL databases, APIs, or cloud storage
- Clean the Data — remove duplicates, handle missing values, fix formatting, standardise columns
- Analyse the Data — calculate averages, identify trends, compare categories, detect patterns
- Visualise Results — bar charts, line charts, pie charts, histograms, scatter plots
- Share Insights — through dashboards, reports, and presentations
This is the point where technical analysis turns into actual business value.
Each stage of this workflow depends on the one before it. Skipping data cleaning, for example, almost always produces misleading visualisations later on, even if the charts themselves look polished. Experienced analysts spend a surprising amount of their time on the collection and cleaning stages precisely because the quality of every later step depends on getting this part right.
Beginner-Friendly Python Analytics Projects
- Student Result Analyser — stores marks, calculates averages, and finds the highest score
- Sales Dashboard — finds total sales, identifies best-selling products, and builds visual charts
- Expense Tracker — records daily expenses and generates monthly spending summaries
- Employee Salary Analysis — calculates the average and department-wise salary distribution
- Customer Feedback Analyser — flags positive vs. negative feedback trends from a CSV file
Related Read: Data Analytics Project Ideas for Students
Practice Exercises
- Create a variable named city and print its value.
- Store five numbers in a list and print the largest number using max().
- Create a dictionary with Name, Age, and Course, and print all three values.
- Write a for loop that prints numbers from 1 to 20 using range(1, 21).
- Create a function that calculates the average of three numbers.
Common Mistakes Beginners Should Avoid
- Skipping programming fundamentals before jumping into libraries
- Copying code without understanding what it does
- Ignoring practice exercises
- Trying to learn too many libraries at once
- Not building any real projects
- Giving up after the first few errors
Consistency matters far more than speed when learning Python.
Career Opportunities After Learning Python
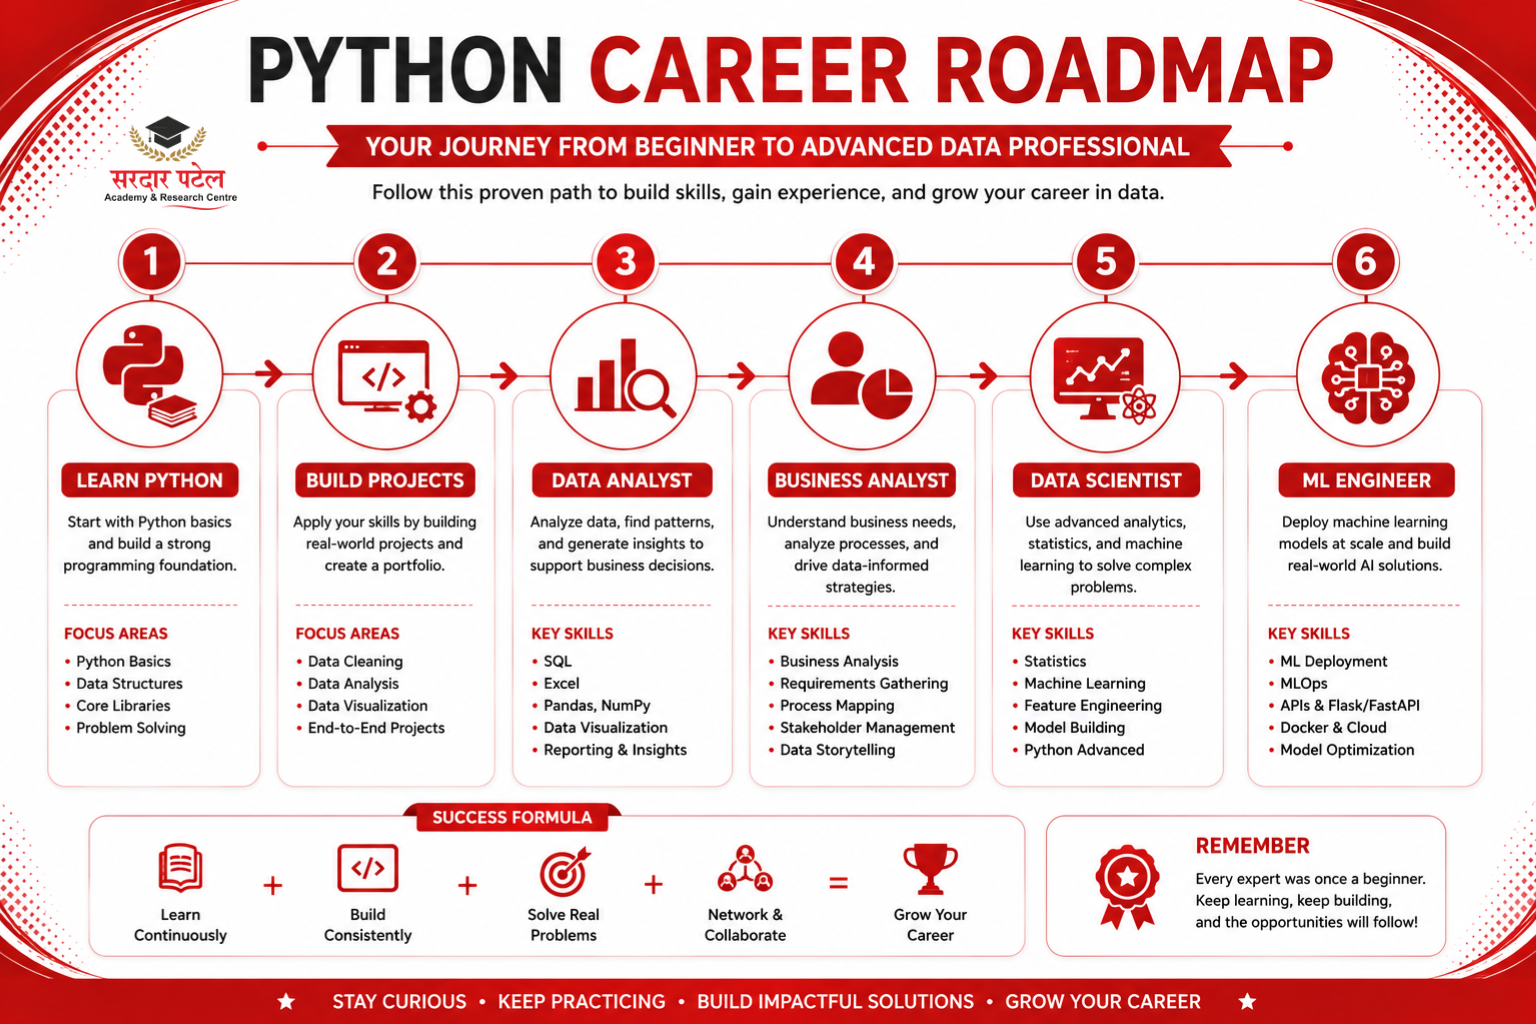
Python skills are valuable across finance, healthcare, retail, e-commerce, and technology. Common roles include Data Analyst, Business Analyst, Python Developer, Data Scientist, Data Engineer, Machine Learning Engineer, and Business Intelligence Developer. As more organisations adopt data-driven decision-making, demand for these roles continues to grow.
Recruiters typically look for a mix of technical and business skills in candidates applying for these positions. Knowing Python alone is rarely enough — employers also value the ability to interpret results and communicate them clearly to non-technical stakeholders. Building a small portfolio of two or three projects, even simple ones like a sales dashboard or an expense tracker, demonstrates this combination far more convincingly than a list of completed courses.
Salary expectations also vary by role and experience level. Entry-level Data Analyst positions generally pay less than specialised roles like Machine Learning Engineer, but they offer a practical starting point for anyone new to the field. Many professionals begin in analyst roles and gradually move into more technical positions as their Python and statistics skills deepen.
Learn Python Analytics with SPARC
Ready to turn your Python knowledge into real-world analytics skills?
At SPARC, you'll gain hands-on experience with:
- Python Programming
- SQL
- Microsoft Excel
- Power BI
- Data Visualisation
- Real Industry Projects
- Placement Assistance
- Expert Mentorship
Our practical training approach helps beginners build job-ready skills and confidence through live projects and guided learning.
Start your Python analytics journey today and take the first step toward a successful career in data analytics!
Enrol Now: Explore SPARC's Data Analytics Course →
Conclusion
Learning Python for data analytics is one of the best investments you can make for your career. Python's simple syntax, extensive libraries, and powerful analytics capabilities make it the preferred programming language for professionals worldwide.
Throughout this tutorial, you've explored Python fundamentals, learned essential programming concepts, understood the analytics workflow, and discovered practical projects to strengthen your skills.
The key to success is consistent practice. Build projects, solve coding challenges, and continue exploring new libraries. Every program you write brings you one step closer to becoming a confident data analyst.
Related Read: SQL vs Python for an Analytics Career
Round Out Your Toolkit: Excel Basics Tutorial | Power BI Dashboard Tutorial
FAQs
No. Python's syntax is simple and readable, making it one of the easiest languages to start with.
Because of libraries like Pandas, NumPy, Matplotlib, and Seaborn, which handle data cleaning, analysis, and visualization with very little code.
Basic math is enough for the fundamentals. Deeper statistics matter more once you move into data science or machine learning.
Most beginners grasp the basics in 6 to 8 weeks of consistent practice. Becoming job-ready usually takes a few months of project-based learning.
Start with Pandas — it's the most widely used library for data cleaning, manipulation, and analysis.
Yes. Python was specifically designed to be beginner-friendly and works well as a first programming language.
SQL, Microsoft Excel, Power BI, Tableau, Git, and basic statistics all pair well with Python and round out an analyst's skill set.