+91 9312966129
 sparc.enquiry01@gmail.com


Best Institute for Excel + SQL + Power BI Learning
Looking for the best Excel SQL Power BI course in Delhi? Learn Excel, SQL, Power BI, live projects, and placement support at SPARC. Download the syllabus today.

Table of Contents
- Why Excel, SQL & Power BI Are Must-Have Skills
- Who Should Join This Course?
- Why Learn Excel, SQL & Power BI Together?
- What You Will Learn
- Excel Module Overview
- Topics Covered:
- Advanced Excel Functions:
- SQL Module Overview
- SQL Topics:
- Practical Activities:
- Power BI Module Overview
- Topics Included:
- Course Comparison Table
- Key Benefits:
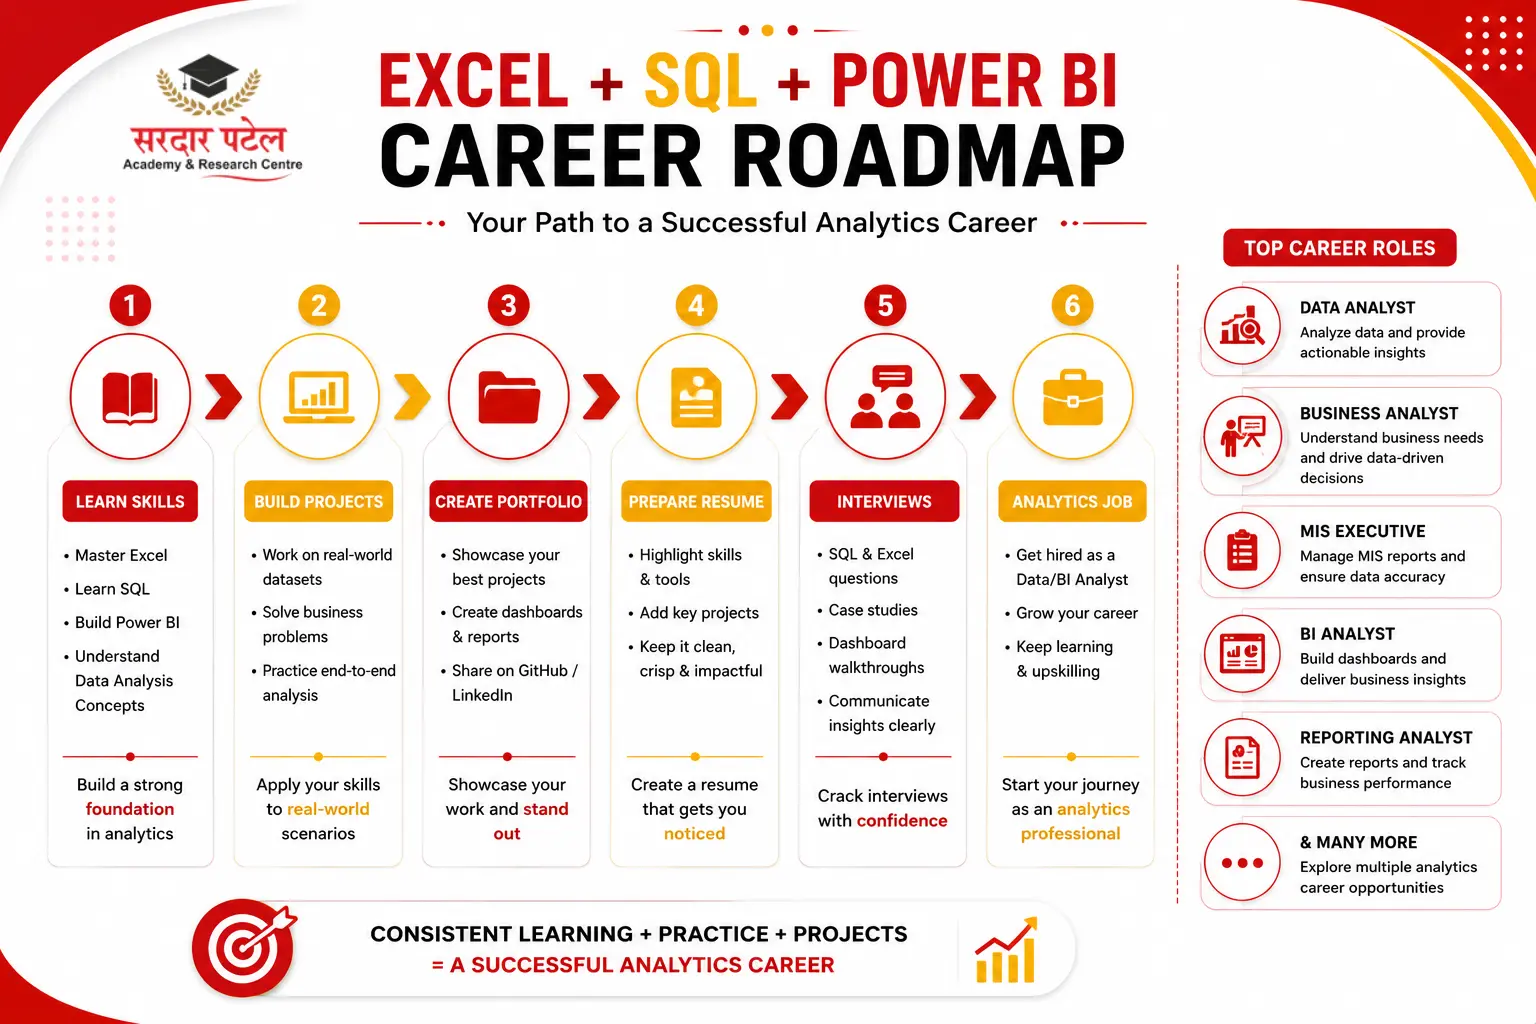
- Career Opportunities After the Course
- Salary Trends
- Conclusion
The demand for professionals who can analyse business data has grown significantly in recent years. Companies across nearly every sector are actively hiring candidates who understand Microsoft Excel, SQL, and Power BI, because these tools help organisations turn raw numbers into informed decisions. What used to be a "nice-to-have" skill set for finance and IT teams has now become a baseline expectation for marketing, HR, operations, and even entry-level business roles.
If you're searching for the best Excel, SQL, and Power BI course in Delhi, choosing the right training institute can genuinely shape your career trajectory. An industry-focused program helps you build technical skills, solve real business problems, and become job-ready from day one — rather than leaving you with theoretical knowledge that doesn't translate into workplace confidence.
Among the leading institutes in Delhi NCR, SPARC (Sardar Patel Academy & Research Centre) offers comprehensive analytics training designed for beginners, students, working professionals, and job seekers. The curriculum centres on applied, project-based learning, live client-style briefs, expert mentorship, and dedicated placement support, so learners leave with a portfolio, not just a certificate. If you're planning to build a complete analytics career, you can also explore our Best Data Analytics Course in Delhi with Placement to understand the complete learning path, career opportunities, and placement support offered at SPARC.
Why Excel, SQL & Power BI Are Must-Have Skills
Businesses generate enormous amounts of data every single day — sales transactions, customer interactions, website visits, inventory movements, and employee records. However, data is valuable only when it can be organised, analyzed, and presented effectively. Raw data sitting in a database or a spreadsheet has no impact on decision-making until someone can extract meaning from it.
These three tools work together to form a complete, end-to-end analytics workflow, and that is exactly why employers rarely ask for just one of them in isolation.
Together, these tools help professionals to:
- Clean and standardise messy data
- Organise and query large databases
- Create detailed, accurate reports
- Build interactive, visual dashboards
- Support faster, evidence-based business decisions
- Improve day-to-day operational efficiency
Who Should Join This Course?
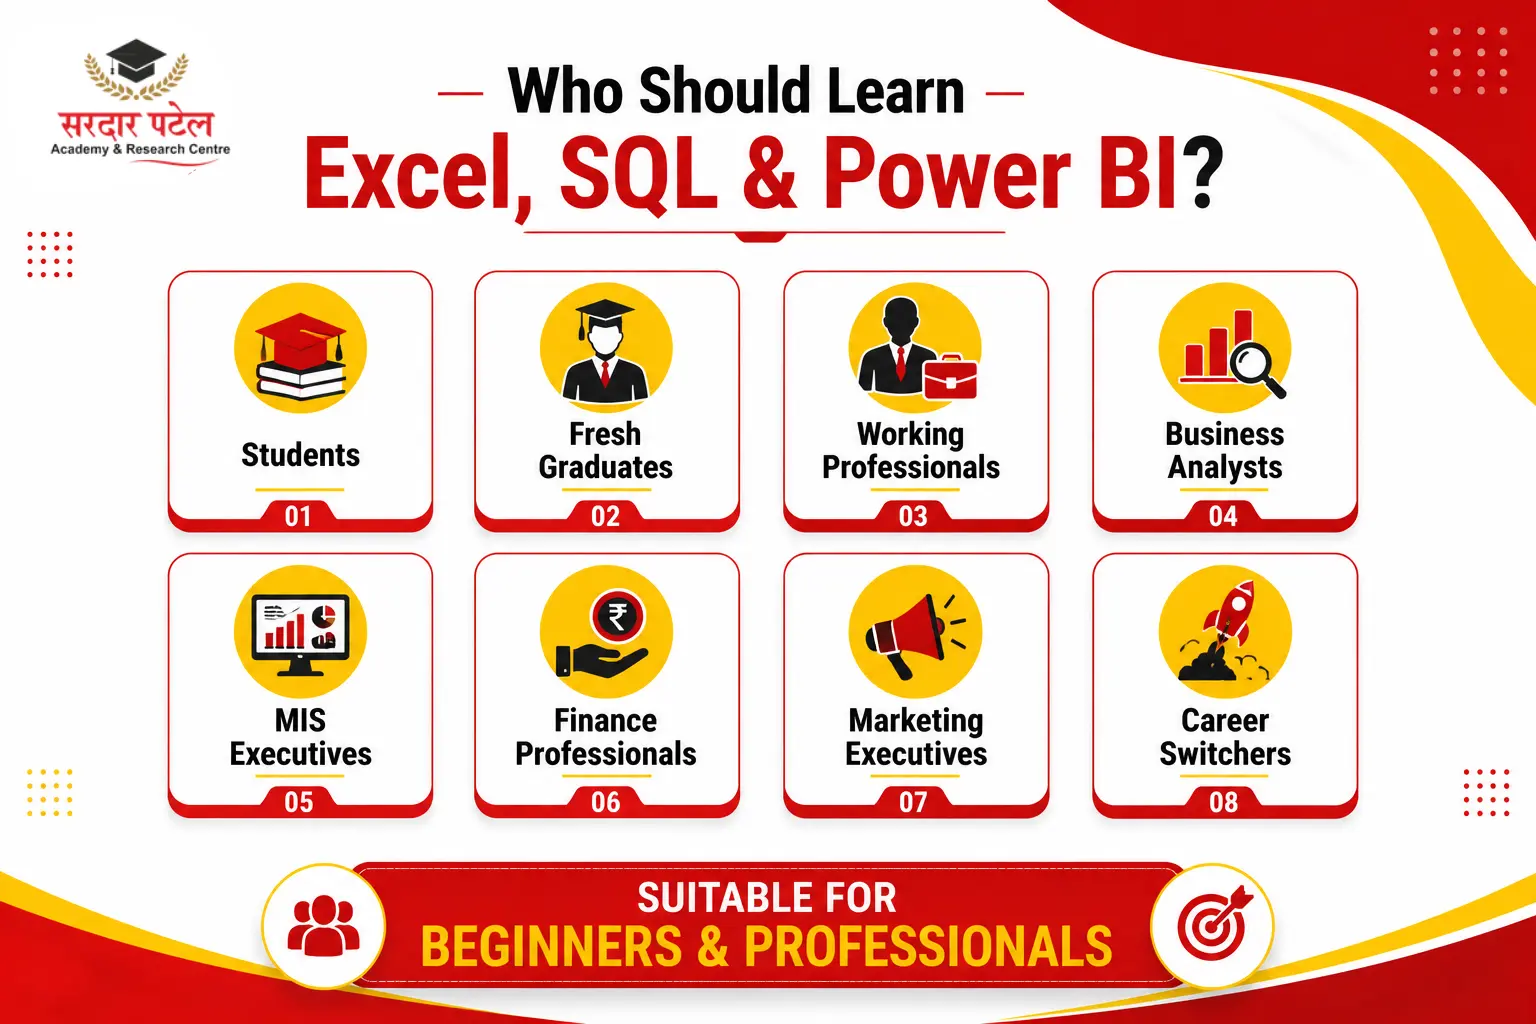
This course is designed to be accessible regardless of your academic or professional background. It is suitable for:
- College students
- Fresh graduates
- Working professionals looking to upskill
- Business analysts
- Data analyst aspirants
- MBA students
- Finance professionals
- Marketing executives
- Entrepreneurs and small business owners
- Career switchers moving into analytics
No prior programming knowledge is required. The course is structured to take a complete beginner from foundational concepts to job-ready, applied skills in a step-by-step manner.
Why Learn Excel, SQL & Power BI Together?
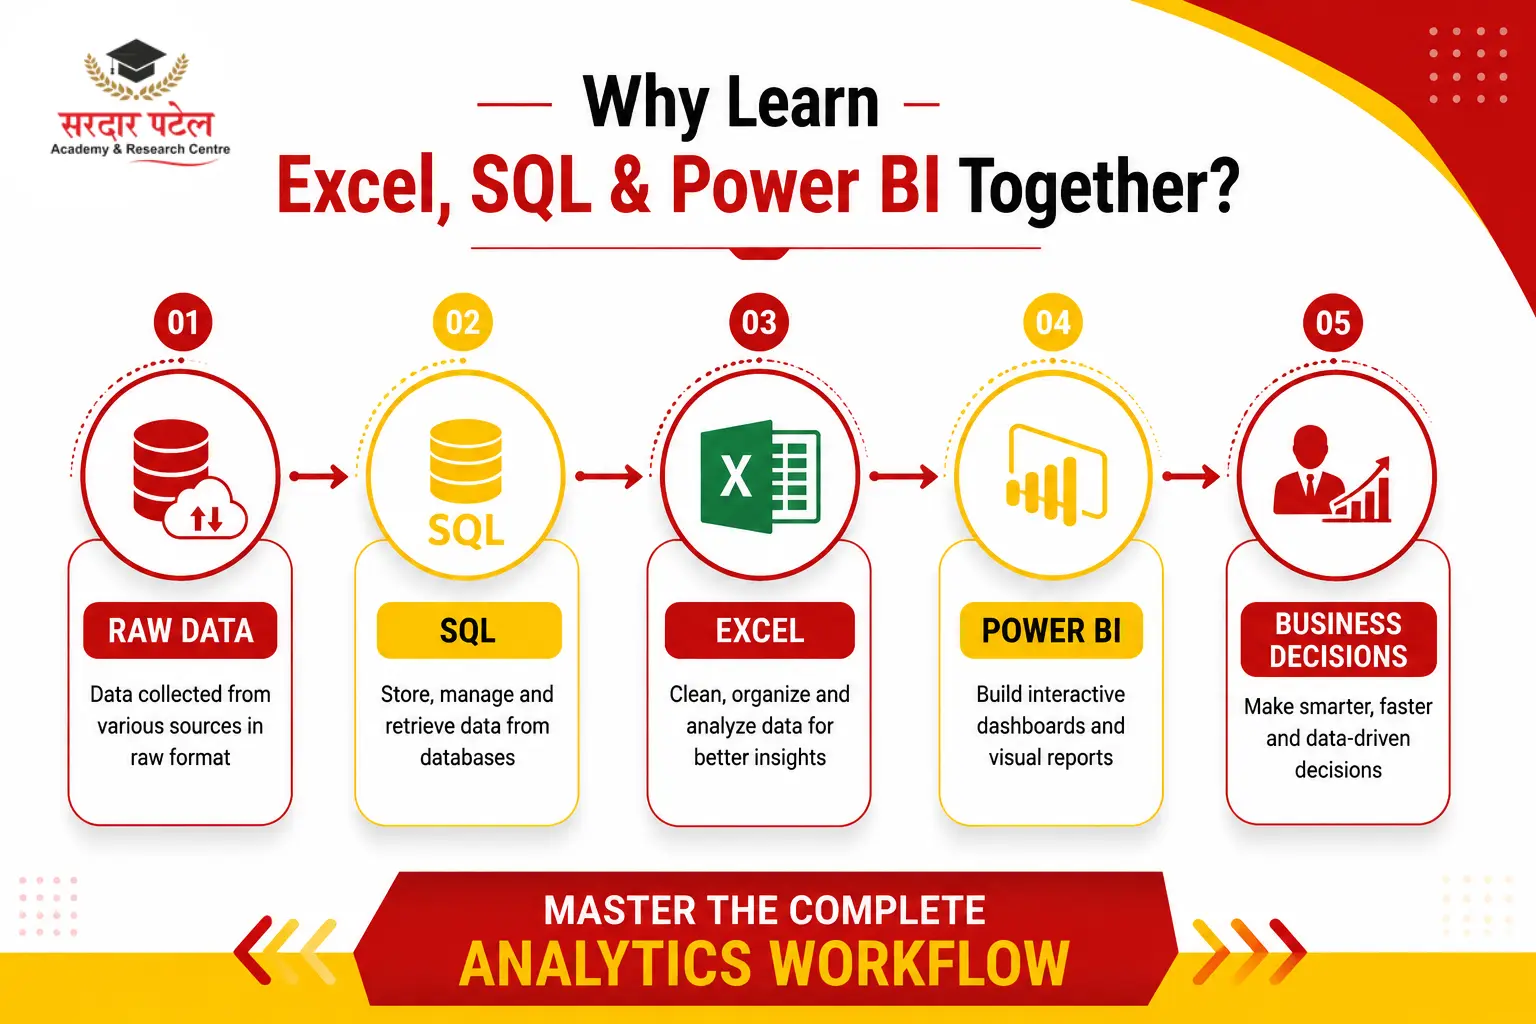
Many learners study these tools separately, often spacing them out over months or years. However, companies expect candidates to understand the complete analytics workflow, not just isolated pieces of it. Learning the tools together mirrors how they are actually used on the job.
- Step 1 — Collect business data from various sources.
- Step 2 — Store and retrieve that data using SQL.
- Step 3 — Analyse and clean the data using Excel.
- Step 4 — Create interactive dashboards in Power BI.
- Step 5 — Present insights clearly to management for decision-making.
Learning them together saves time, reinforces each tool through practical use, and significantly improves employability compared to learning them in isolated, disconnected courses.
What You Will Learn
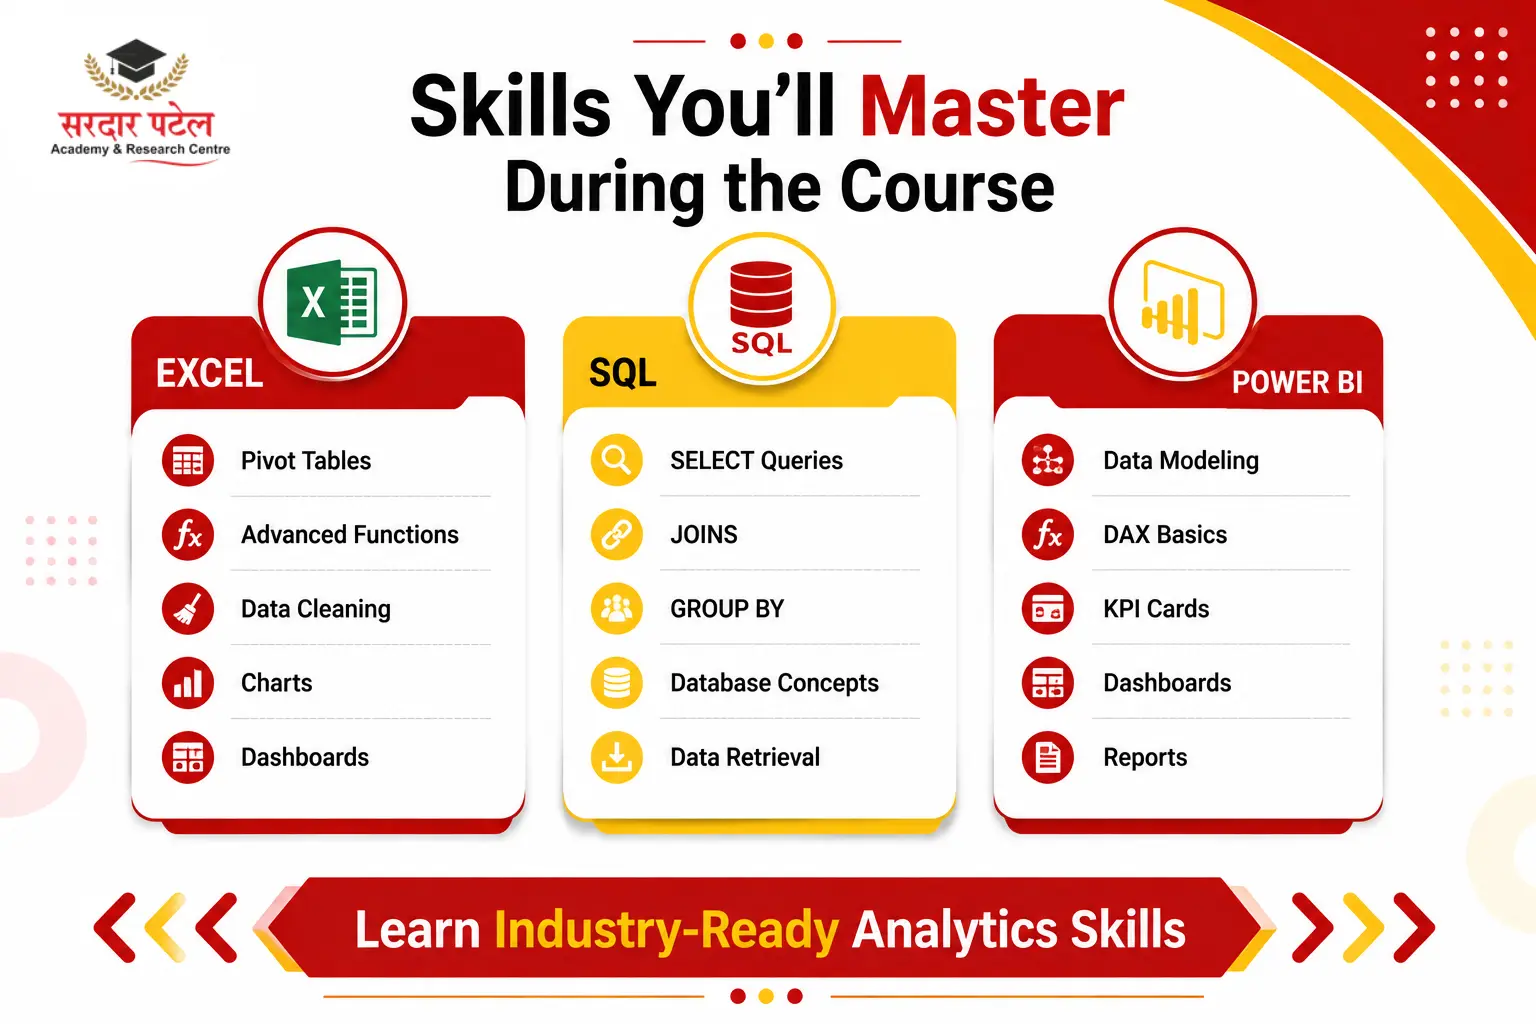
The course is built around real-world business scenarios rather than abstract exercises. Core skills covered include:
- Data Cleaning
- Data Transformation
- Pivot Tables
- Advanced Excel Functions
- SQL Queries
- Database Design
- Data Visualisation
- Dashboard Development
- KPI Reporting
- Business Reporting
- Interactive Charts
- Power Query
- DAX Basics
Excel Module Overview
Microsoft Excel remains one of the most widely used business tools in the world, and mastering it well beyond basic formulas is often what separates a competent analyst from an average one.
Advanced Excel is the foundation of business reporting and data analysis. If you're new to Excel, start with our Excel Tutorial for Data Analytics Beginners to understand formulas, Pivot Tables, and data cleaning techniques before moving to advanced concepts.
Topics Covered:
- Excel Interface
- Formatting Techniques
- Formulas
- Functions
- Conditional Formatting
- Data Validation
- Lookup Functions
- Pivot Tables
- Pivot Charts
- Dashboards
- Power Query Basics
- Data Cleaning
- What-If Analysis
Advanced Excel Functions:
- VLOOKUP
- XLOOKUP
- INDEX
- MATCH
- IF
- SUMIFS
- COUNTIFS
- TEXT Functions
- Date Functions
SQL Module Overview
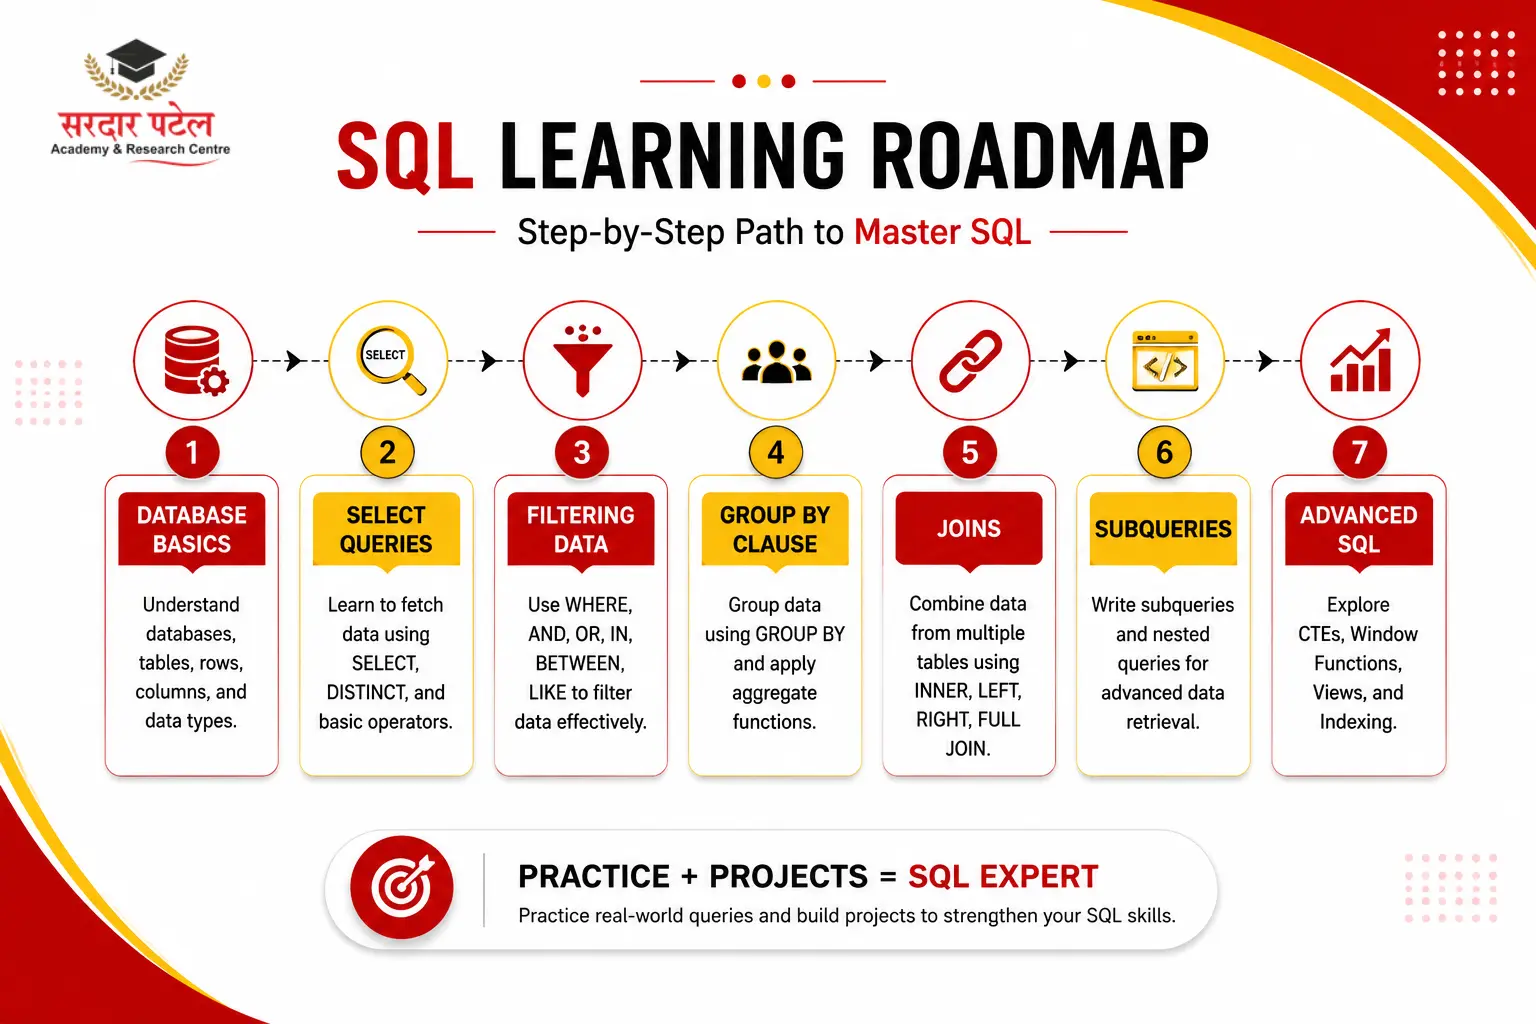
SQL is the language used to manage and query relational databases. Students learn how to retrieve, update, and analyse structured data — a skill that is essential across nearly every data-driven role, from analyst to developer.
If you're completely new to databases, we recommend reading our SQL Basics Tutorial for Students before starting advanced SQL queries and joins covered in this course.
SQL Topics:
- Introduction to Databases
- Database Concepts
- TablesPrimary Keys
- Foreign Keys
- SELECT
- WHERE
- ORDER BY
- GROUP BY
- HAVING
- Aggregate Functions
- JOINS
- UNION
- Views
- Subqueries
- Stored Procedures (Basics)
Practical Activities:
- Writing SQL Queries
- Customer Database Analysis
- Sales Report Generation
- Inventory Analysis
Power BI Module Overview
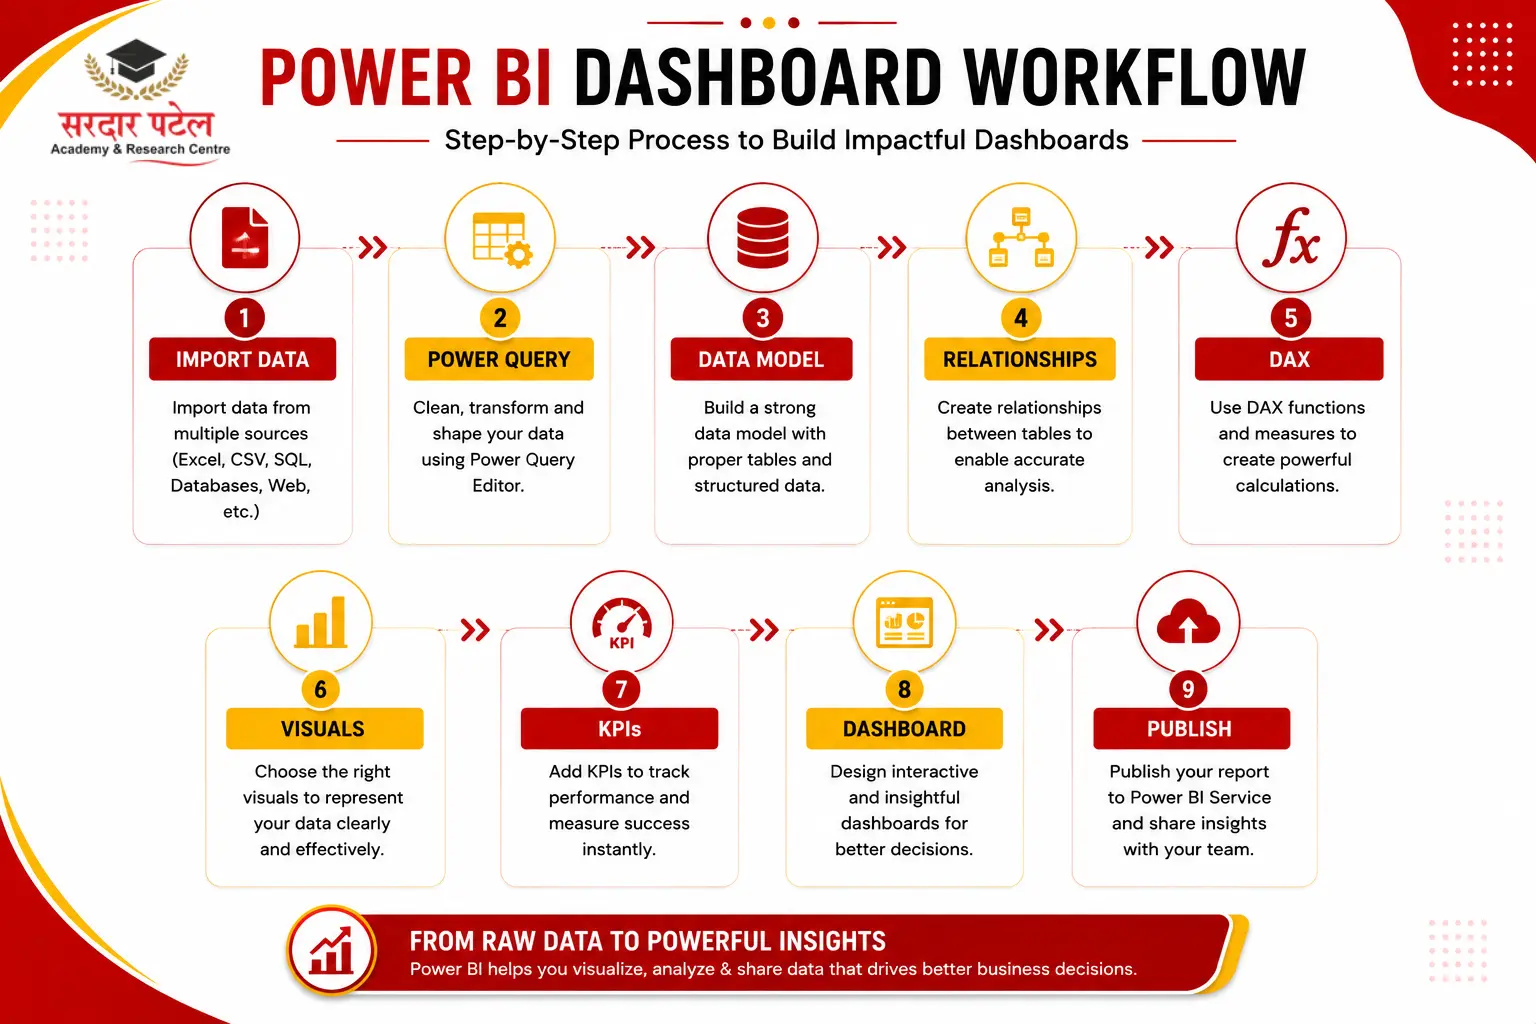
Power BI converts raw business data into meaningful, interactive dashboards that decision-makers can actually use in real time, rather than static reports that go stale the moment they're printed.
Once you've learned the fundamentals, you can enhance your visual skills with our Power BI Dashboard Tutorial, where you'll learn to build interactive dashboards using real business datasets.
Topics Included:
- Power BI Interface
- Data Import
- Power Query
- Data Modelling
- Relationships
- DAX Basics
- KPI Cards
- Charts
- Maps
- Filters
- Interactive Dashboards
- Report Publishing
Students create dashboards for practical business functions, including:
- Sales
- HR
- Finance
- Marketing
- Inventory
- Business Performance
Course Comparison Table
Why Choose SPARC?
Choosing an institute is just as important as choosing the course itself. SPARC (Sardar Patel Academy & Research Centre) has established itself as a trusted training institute in Delhi NCR by focusing on applied, career-oriented education rather than purely theoretical instruction.
Key Benefits:
- Industry-focused curriculum
- Experienced trainers
- Practical lab sessions
- Live projects
- Small batch sizes
- Doubt-clearing sessions
- Flexible learning options
- Resume preparation
- Mock interviews
- Placement assistance
- Career guidance
Students gain hands-on exposure instead of only theoretical knowledge, which makes a measurable difference when it comes to interviews and on-the-job performance.
Want to know more about the course structure? Visit the Excel SQL Power BI Course at SPARC page to explore modules, live projects, certifications, and admission details.
Career Opportunities After the Course
The demand for Excel, SQL, and Power BI skills extends across a wide range of sectors, including:
- Information Technology
- Banking
- Healthcare
- Retail
- E-commerce
- Manufacturing
- Telecommunications
- Education
- Consulting
- Logistics
This breadth means analytics skills aren't tied to a single career path — they open doors across almost the entire job market.
Salary Trends
Salaries in analytics roles vary depending on skills, location, company size, and experience, so the figures below should be treated as broad, indicative ranges rather than guarantees. Glassdoor data cited in multiple 2026 industry salary guides places the national average data analyst salary in India at roughly ₹6.87 LPA, with fresher packages typically landing between ₹3.5 LPA and ₹6 LPA depending on degree background, city, and demonstrable project work.
Figures are indicative national averages compiled from Glassdoor, AmbitionBox, and PayScale data reported in 2026 industry salary guides; actual offers vary by city, company type, and negotiated skills.
A few patterns are worth noting for anyone weighing this investment:
- Metro hubs such as Bengaluru and Hyderabad tend to pay 15–18% above the national average, with Delhi NCR close behind.
- Demonstrated proficiency in SQL, Power BI, and Python together can lift compensation 20–35% above peers who know only one of these tools.
- The steepest salary growth typically happens between Year 1 and Year 3, especially for analysts who switch roles once they have a strong project portfolio to show.
Candidates with real project experience and a strong portfolio generally have stronger placement prospects, and can often negotiate better starting offers than those relying on certifications alone.
Conclusion
The combination of Excel, SQL, and Power BI has become one of the most valuable skill sets for aspiring analytics professionals. Instead of learning these tools individually and piecing together a disjointed skill set, enrolling in a structured program allows you to develop applied expertise, build real-world projects, and prepare for actual industry requirements from the very start.
If you are looking for the best Excel SQL Power BI course in Delhi, SPARC (Sardar Patel Academy & Research Centre) offers an industry-oriented curriculum, expert trainers, applied learning, live projects, and dedicated placement support. Whether you are a student, a graduate, or a working professional, this training can help you build a strong foundation in analytics and meaningfully advance your career.
FAQs
This course is suitable for students, fresh graduates, working professionals, job seekers, and anyone who wants to build a career in data analytics or business intelligence. No prior background in analytics is assumed.
No. The course is beginner-friendly and starts with the basics of Excel, SQL, and Power BI. No programming experience is required to begin.
Yes. SPARC offers applied training through real-world assignments, live projects, case studies, and dashboard development to help students gain genuine on-the-job experience, not just theoretical knowledge.
Yes. SPARC provides placement support, including resume building, mock interviews, career guidance, and interview preparation, to help students become fully job-ready.
After completing the course, you can apply for roles such as Data Analyst, Business Analyst, BI Analyst, MIS Executive, Reporting Analyst, and Dashboard Developer across various industries.
SPARC offers an industry-oriented curriculum, experienced trainers, applied project-based learning, live projects, flexible batches, and dedicated placement assistance, making it a reliable choice for aspiring analytics professionals.