+91 9312966129
 sparc.enquiry01@gmail.com



What Is Natural Language Querying in Data Analytics?
Learn how natural language querying in data analytics works, its benefits, tools, real-world uses, challenges and future trends.

Table of Contents
- What Is Natural Language Querying?
- How Natural Language Querying Works
- 1. Language understanding
- 2. Mapping to your data
- 3. Query generation
- 4. Presenting the result
- NLQ vs. Traditional BI
- Conversational BI: The Next Step
- Natural Language Querying Tools You Can Try
- Key Benefits of Natural Language Querying
- Data access for more people.
- Faster decisions.
- Less pressure on data teams.
- A stronger data culture.
- Real-World Use Cases
- Challenges and Limitations
- Best Practices for Getting Started
- Tips for Asking Better Questions
- The Future of Natural Language Querying
- Conclusion
- Want to work with these tools yourself?
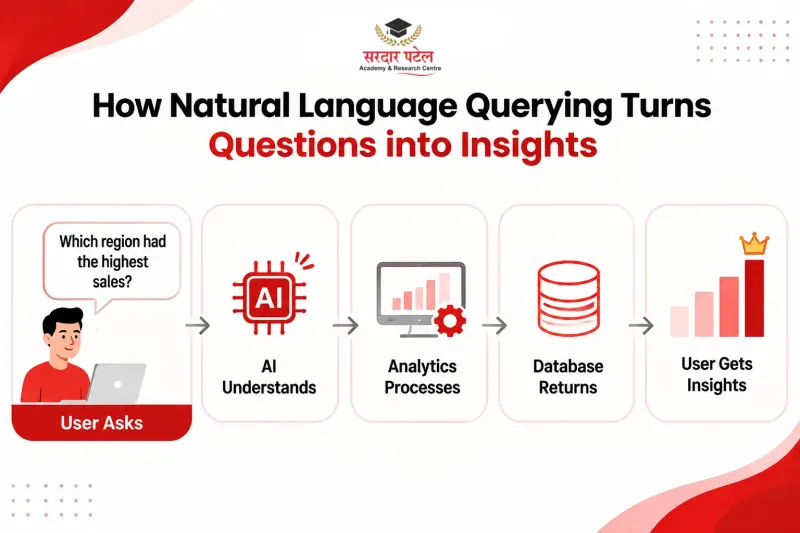
Imagine typing “Which region had the highest sales last quarter?” and often getting an easy-to-read chart within seconds. No SQL, no waiting for the data team, no ticket in a queue. That is the promise of natural language querying (NLQ) in data analytics, and it is changing how teams work with data.
In this guide, you will learn what natural language querying is, how it works behind the scenes, where it helps most, and what to watch out for before adopting it.
What Is Natural Language Querying?
Natural language querying (NLQ) is a technology that lets people retrieve and analyse data by writing or speaking questions in everyday language, instead of code. The system reads your question, works out what you mean, and returns an answer as a number, table, or chart.
Traditionally, getting insights meant knowing SQL or depending on analysts to build dashboards, a skill covered in this Power BI dashboard tutorial. NLQ removes that barrier. A marketing manager, a store owner, or a finance lead can ask questions of data the same way they would ask a colleague.
How Natural Language Querying Works
Behind a simple question box sits a multi-step process.
1. Language understanding
The system breaks your question into parts. It identifies the metric (sales), the dimension (region), the time frame (last quarter), and the intent (find the highest).
2. Mapping to your data
Next, it matches those terms to real tables, columns, and definitions. Many tools use a semantic layer, a shared dictionary where “revenue” or “active customer” has one agreed meaning across the company.
3. Query generation
The tool converts your request into a database query, usually SQL, and runs it against the data source.
4. Presenting the result
Finally, it picks a suitable format, such as a bar chart for comparisons or a line chart for trends, and shows the answer.
Many of today’s AI-powered analytics systems use large language models (LLMs) to make data queries more intuitive. These models generally handle vague phrasing, spelling mistakes, and follow-up questions better than older keyword-based search boxes, which is why they appear on lists of AI Tools Every Data Analyst Should Know.
NLQ vs. Traditional BI
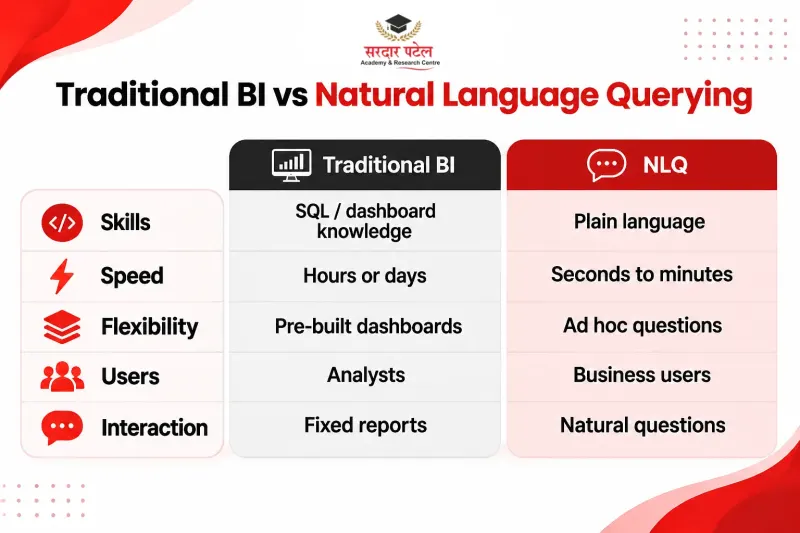
| Aspect |
Traditional BI |
Natural language querying |
| Skill needed |
SQL or dashboard training |
Ability to ask a question |
| Speed to insight |
Typically hours or days |
Often seconds to minutes |
| Flexibility |
Limited to built dashboards |
Ad hoc, any question the data can answer |
| Who uses it |
Analysts, specialists |
Anyone in the business, with the right access |
Dashboards remain valuable for monitoring established business metrics and key performance indicators. If you are new to them, start with this Beginner Guide to Business Intelligence. NLQ shines when you have a new, unexpected question that no dashboard anticipated.
Conversational BI: The Next Step
Conversational BI builds on NLQ by remembering context, so you can have a back-and-forth with your data. For example, you might ask for monthly revenue for 2026, then say “Now break that down by product category.” Some tools can also explain a change when you ask “Why did March drop?”, though not every NLQ tool offers this. Conversational BI is one part of What Is Augmented Analytics and How Does It Work?.
Natural Language Querying Tools You Can Try
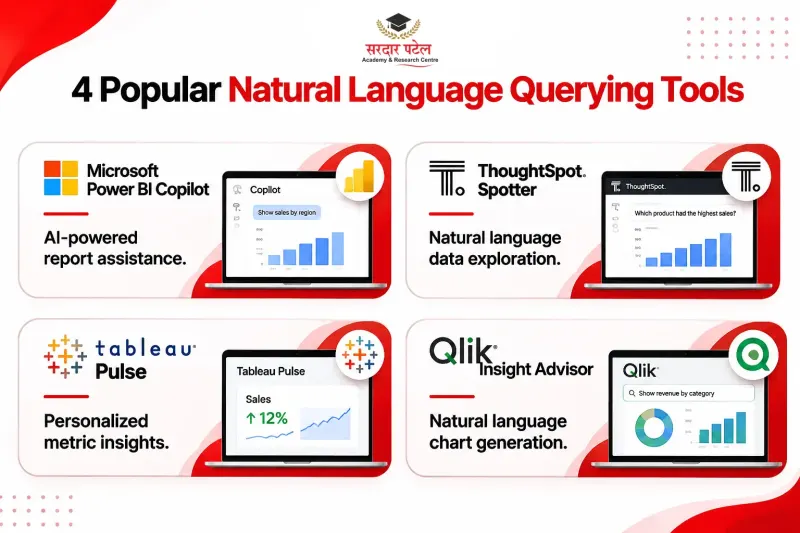
Several major platforms offer NLQ or closely related features. The notes below come from each vendor’s own documentation. Features and licensing change often, so confirm current details before you buy.
| Tool |
What it offers |
Vendor documentation |
| Power BI Copilot |
A chat-based assistant that can summarise report pages, answer questions about your data, and help write DAX. It needs admin enablement and paid capacity, so a basic licence alone is not enough. Read our Power BI Copilot guide. | Microsoft Learn↗ |
| ThoughtSpot Spotter |
Described by the vendor as an AI analyst. Users ask business questions in plain language and get charts with written summaries. | Spotter docs ↗ |
| Tableau Pulse |
Gives people personalised insights about the metrics they follow, so they do not have to build an analysis themselves. A site administrator must switch it on. | Tableau Help ↗ |
| Qlik Insight Advisor |
Part of Qlik Sense. It generates charts from natural-language questions and surfaces relationships you may have missed. |
Qlik Help ↗ |
Key Benefits of Natural Language Querying
Data access for more people.
When non-technical staff can answer their own questions, data stops being a privilege held by a few specialists.
Faster decisions.
Waiting days for a report slows down action. With NLQ, a sales lead can check performance before a client call, not after.
Less pressure on data teams.
Analysts spend less time on repetitive requests such as “can you pull last month’s numbers?” and more time on modelling, forecasting, and strategy.
A stronger data culture.
People who can easily ask questions tend to ask more of them. Over time, this builds a habit of checking evidence before making decisions.
Real-World Use Cases
- Retail and e-commerce: A store manager asks, “Which products had the most returns this week?” and quickly spots a quality issue.
- Finance: A CFO types, “Compare operating costs against budget by department,” and gets a variance view.
- Marketing: A campaign lead asks, “Which channel brought the cheapest leads in October?” and shifts budget accordingly.
- Healthcare operations: Administrators ask about patient wait times by clinic to find where staffing needs attention.
- Human resources: HR teams explore attrition by team or tenure without waiting for a custom report.
Challenges and Limitations
NLQ is powerful, but it is not magic. Knowing its limits helps you use it wisely.
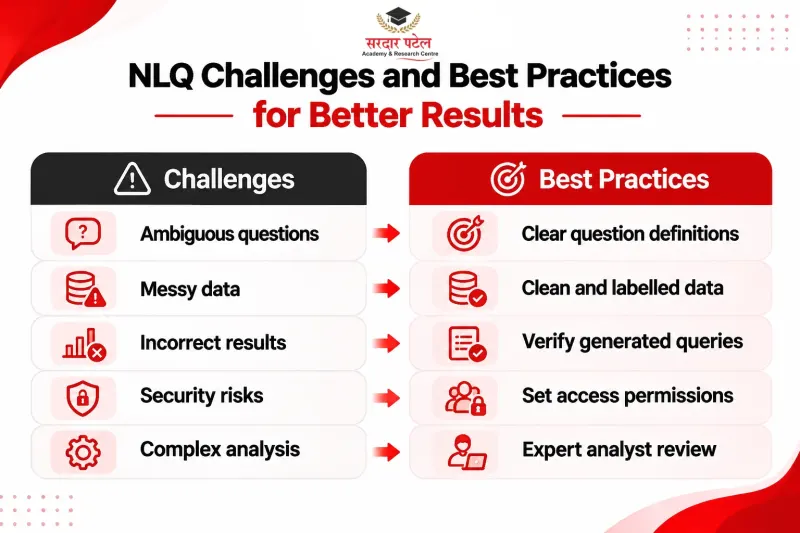
Ambiguous questions. “Show me top customers” could mean top by revenue, by order count, or by profit. Good tools ask a clarifying question or show their assumption.
Messy data. If column names are unclear or data is inconsistent, even the best AI can return confusing answers. Clean, well-documented data is essential.
Trust and accuracy. Generated queries can occasionally be wrong. Look for tools that show the underlying logic so users can verify results.
Security and governance. Natural language data queries should follow the same strict access permissions and security standards used for dashboards.
Complex analysis. Advanced statistical modelling or highly custom calculations may still need an expert analyst.
Best Practices for Getting Started
- Start with a focused use case. Pick one team and one dataset, such as sales data for the revenue team, and expand after you see results.
- Build a semantic layer. Define key business terms once so everyone gets consistent answers.
- Clean and label your data. Use readable column names and remove duplicates first; our guide to How AI Is Changing Data Cleaning and Data Preparation shows how.
- Set permissions early. Decide who can see what before rolling out access widely.
- Train users to ask clear questions. Specific questions with a metric, a time frame, and a breakdown give the best results.
- Verify important answers. For high-stakes decisions, check the generated query or cross-check with a trusted report.
- Gather feedback. Track which questions fail and use them to improve definitions and data quality.
Tips for Asking Better Questions
- Include the time period: “in the last 90 days.”
- Name the metric clearly: “net revenue,” not just “money.”
- Request a breakdown: “by region and product.”
- Use follow-ups to refine instead of starting over.
These small habits make a big difference to the quality of results you receive.
The Future of Natural Language Querying
Expect tools that suggest questions proactively, explain why a metric changed, and combine text, charts, and short summaries in one response. Some vendors are also adding voice-based questions and multilingual support, which could open data access to teams that work in regional languages. These trends sit under the wider umbrella of augmented analytics.
Conclusion
Natural language querying in data analytics turns data from a technical resource into an everyday tool. By letting more people ask questions of data in plain language, it speeds up decisions, reduces bottlenecks, and supports a more data-driven culture. Success depends on good data, clear definitions, and sensible governance, but the payoff can be significant.
Want to work with these tools yourself?
Sardar Patel Academy & Research Centre (SPARC) in GTB Nagar, Delhi, offers the Data Analytics Course with AI, an 8-month program with 40+ projects covering Excel, SQL, Python, Power BI, Tableau, and modern AI tools, with placement support. Book a free demo class and start building job-ready analytics skills.
Call: +91 93129 66129
Visit: 2514, Hudson Lane, Kingsway Camp (opposite Laxmi Dairy), near GTB Nagar Metro Station Gate No. 4, Delhi 110009
FAQs
No. You type or speak your question in plain language, and the tool writes and runs the query for you.
Not exactly. NLQ answers a question. Conversational BI builds on it by remembering context, so you can ask follow-ups in a continuous chat.
Accuracy depends on your data quality and definitions. Tools that show the generated query make it easier to verify results.
No. It handles routine questions so analysts can focus on modelling, governance, and strategy.